
Understanding Deep Insights Report
Updated
After creating the Deep Insight report, you can view the different clusters and take out actionable insights from the reports.
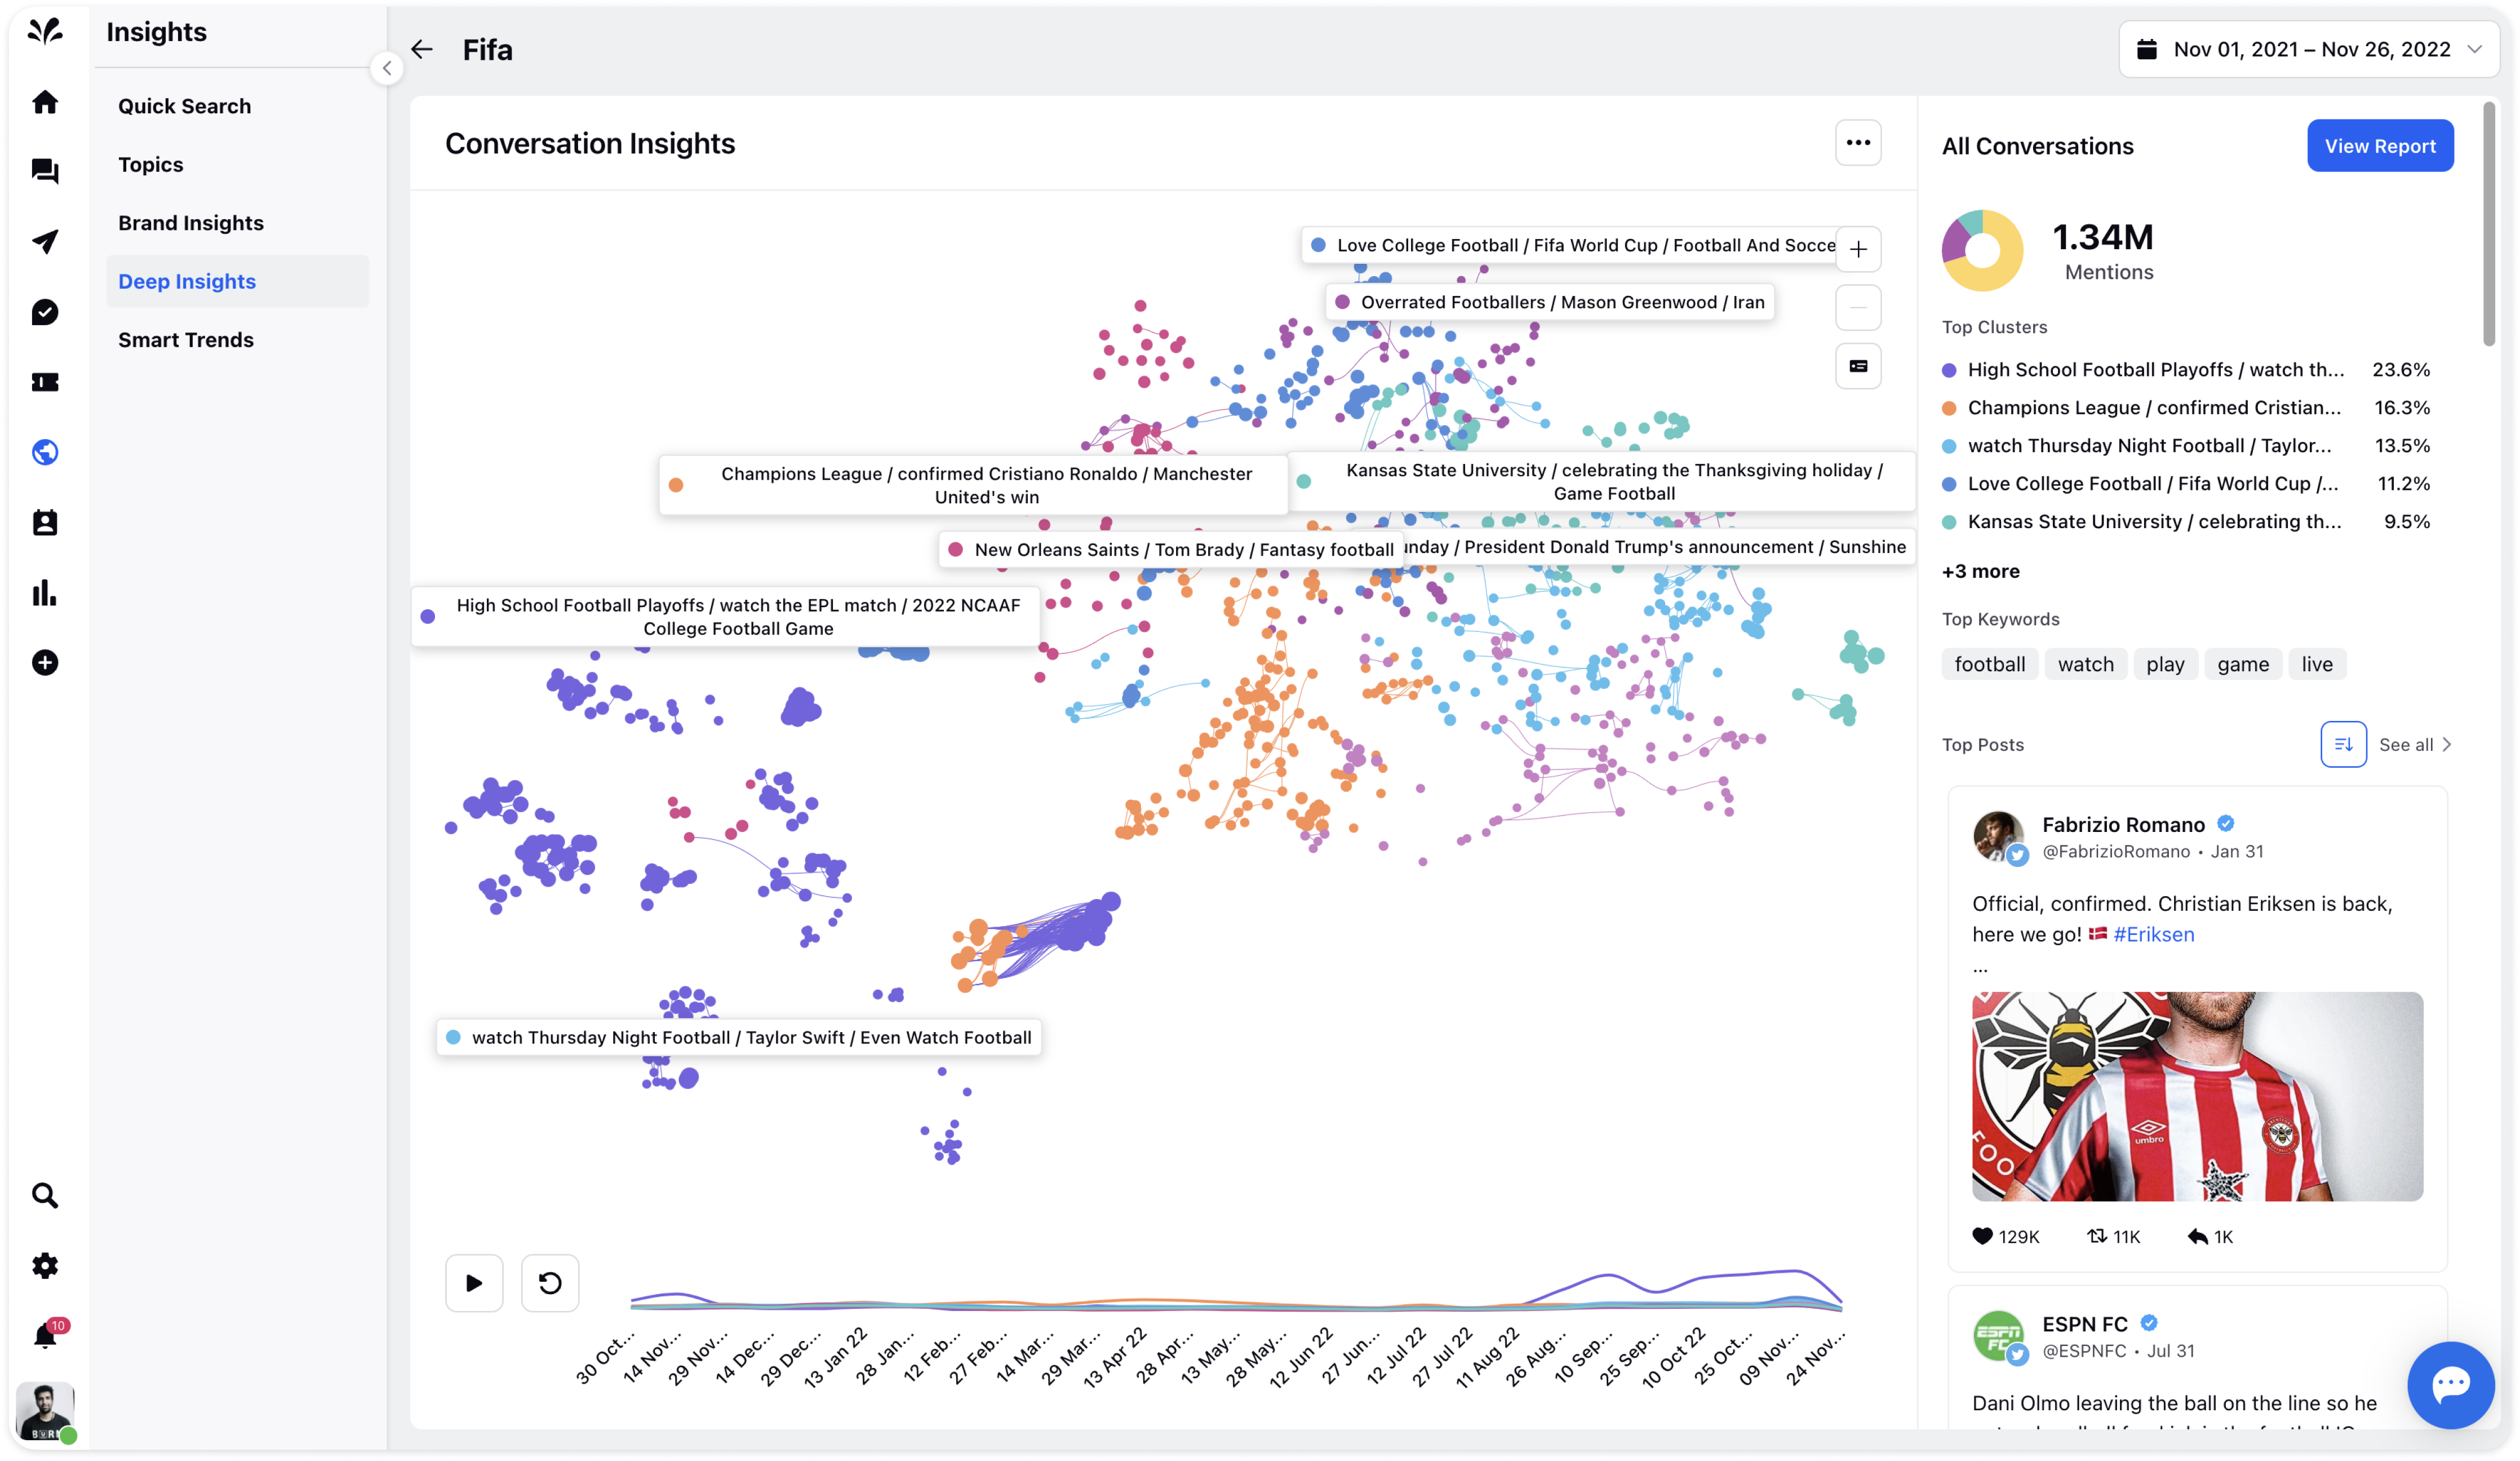
The report is divided into 3 parts-
Cluster Section on the Left which gives a visual representation of all the clusters which can be grouped and visualized on a time scale as well using the time chart available at the bottom
Conversation Section on the Right which gives a summary and distribution of Top Clusters which can be clicked for further details
Top Posts which can be used to directly check out the top posts falling within the cluster
After creating and analyzing the Conversation Cluster report in Conversation Insights, there are several actions and interactions you can take in the Conversation Cluster report like-
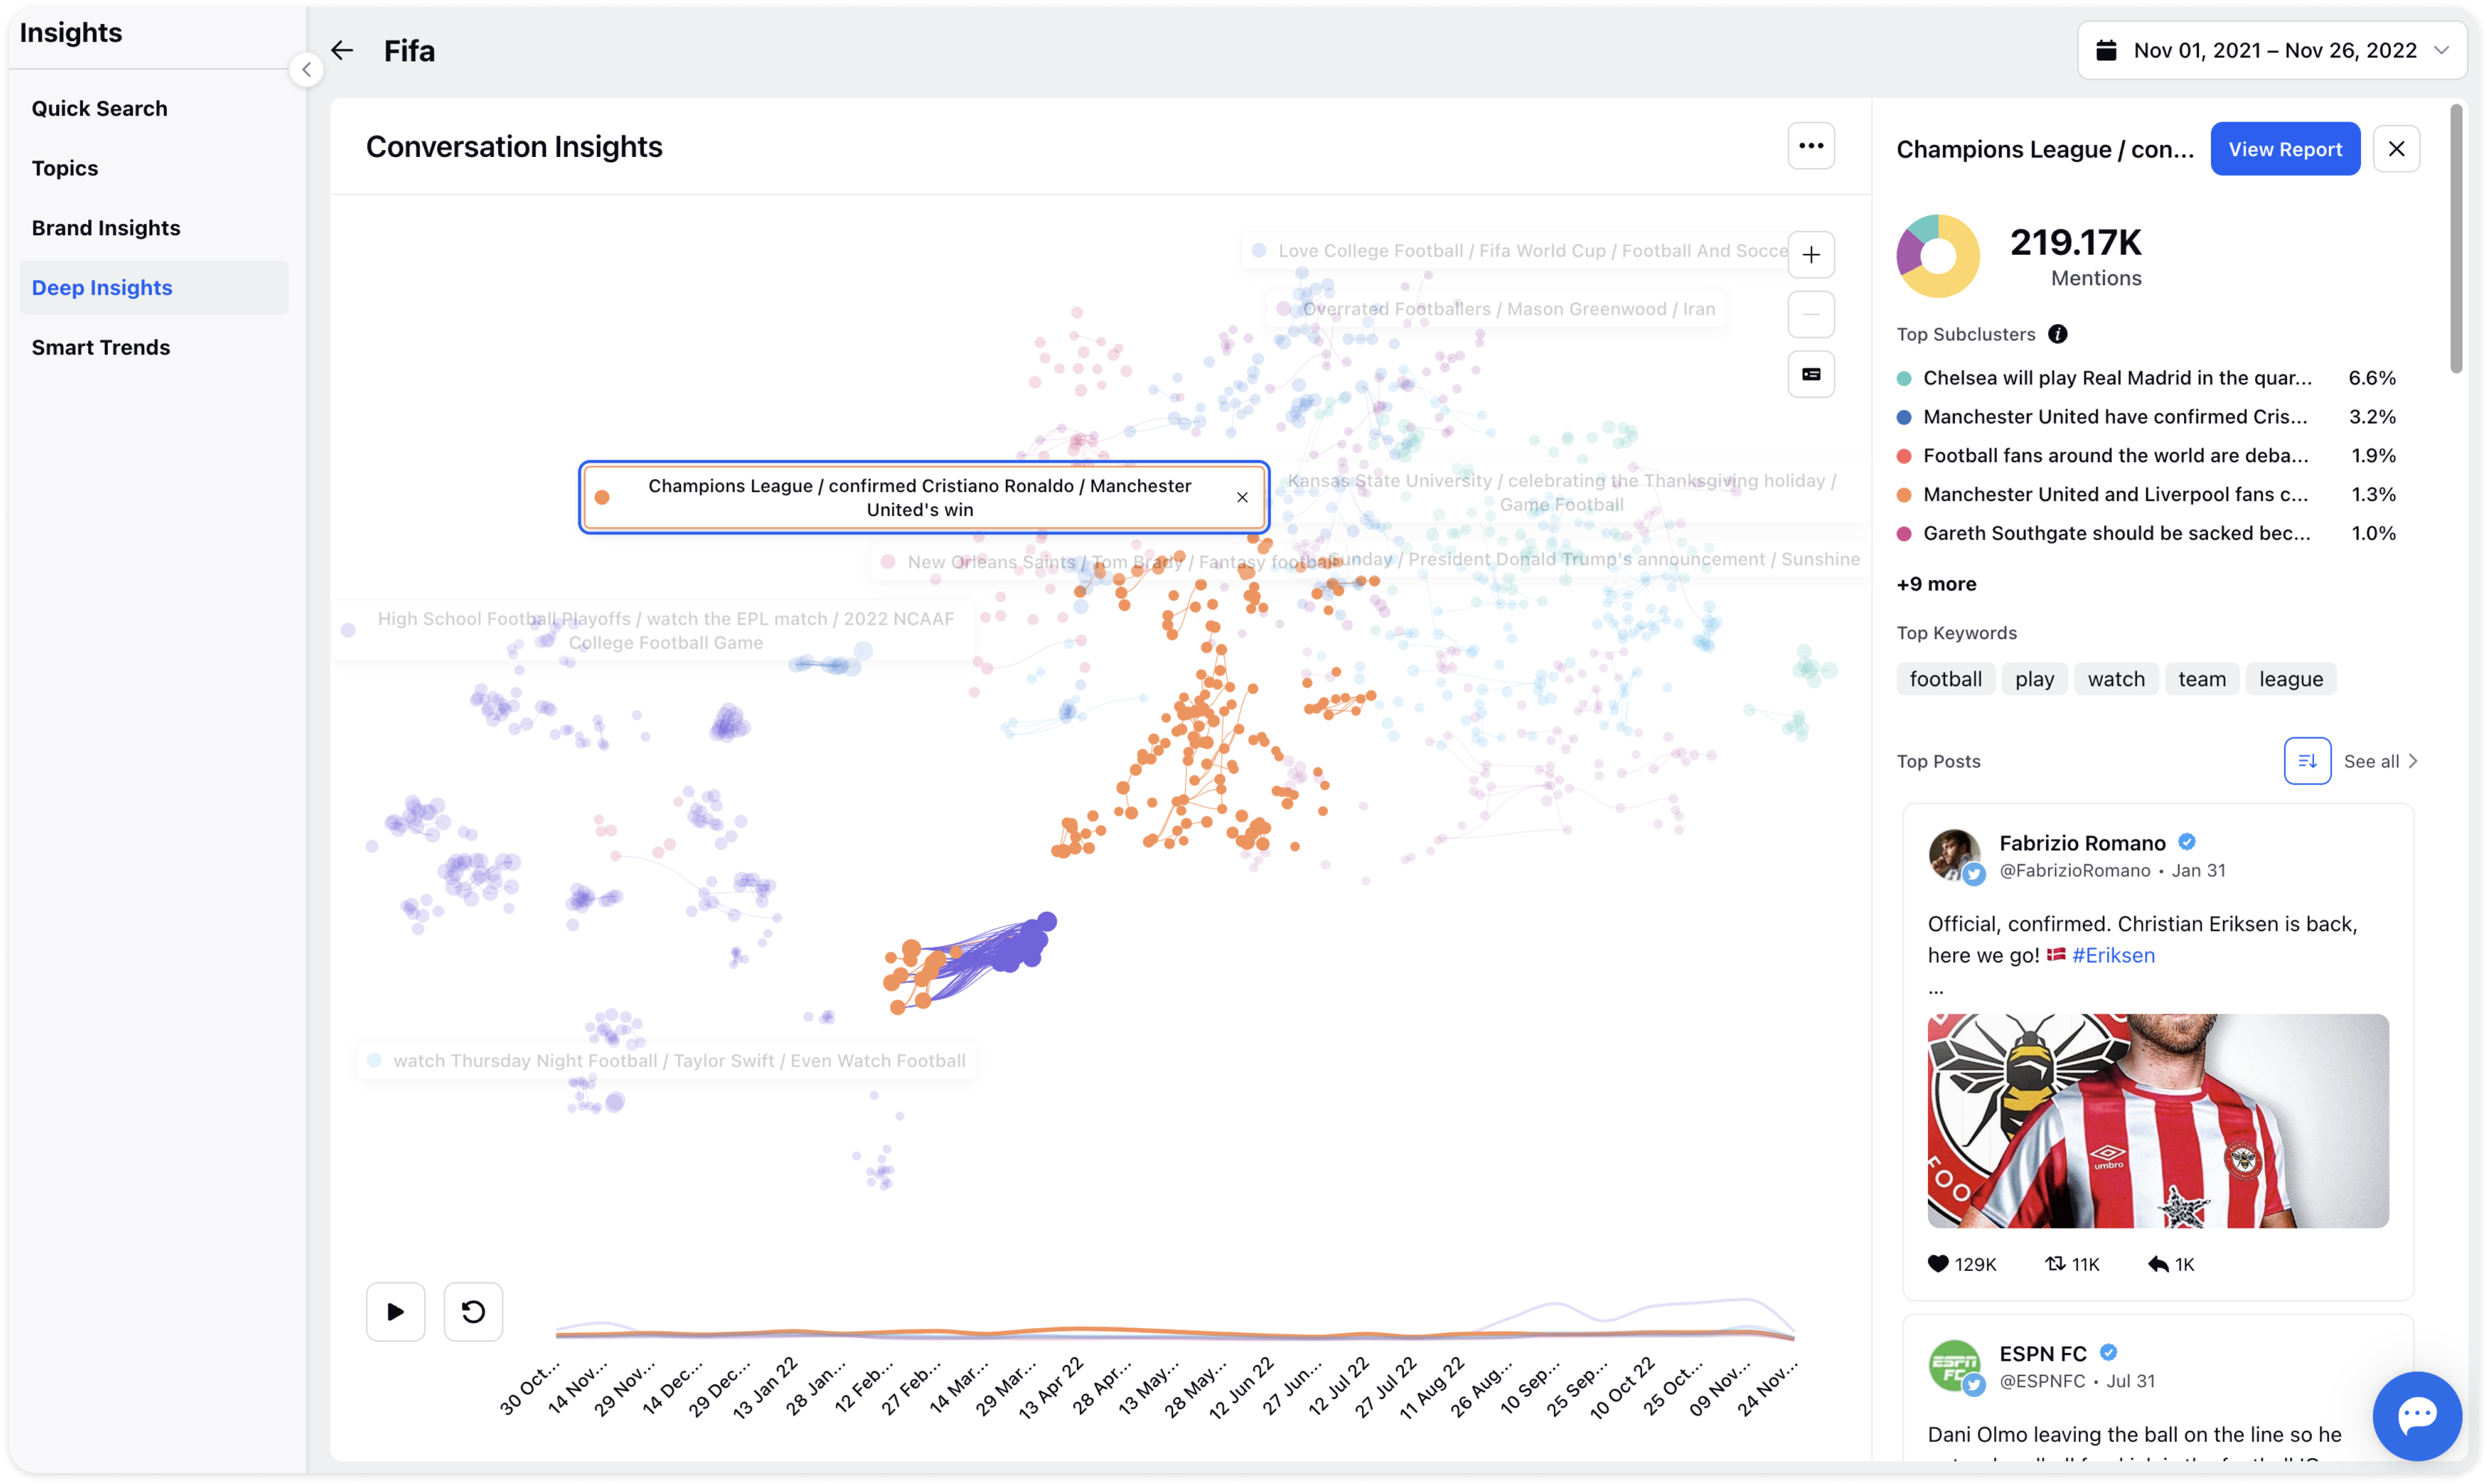
Single Click on any cluster to focus on cluster
When you single-click on any cluster label, that particular cluster will be highlighted. Besides, nodes connected with that particular cluster will also be highlighted so the relationship can be seen clearly. Upon doing that, the right pane will be updated with the information about the selected cluster: List of Top-subclusters by Volume (if any), Top Keywords, and Conversation Stream.
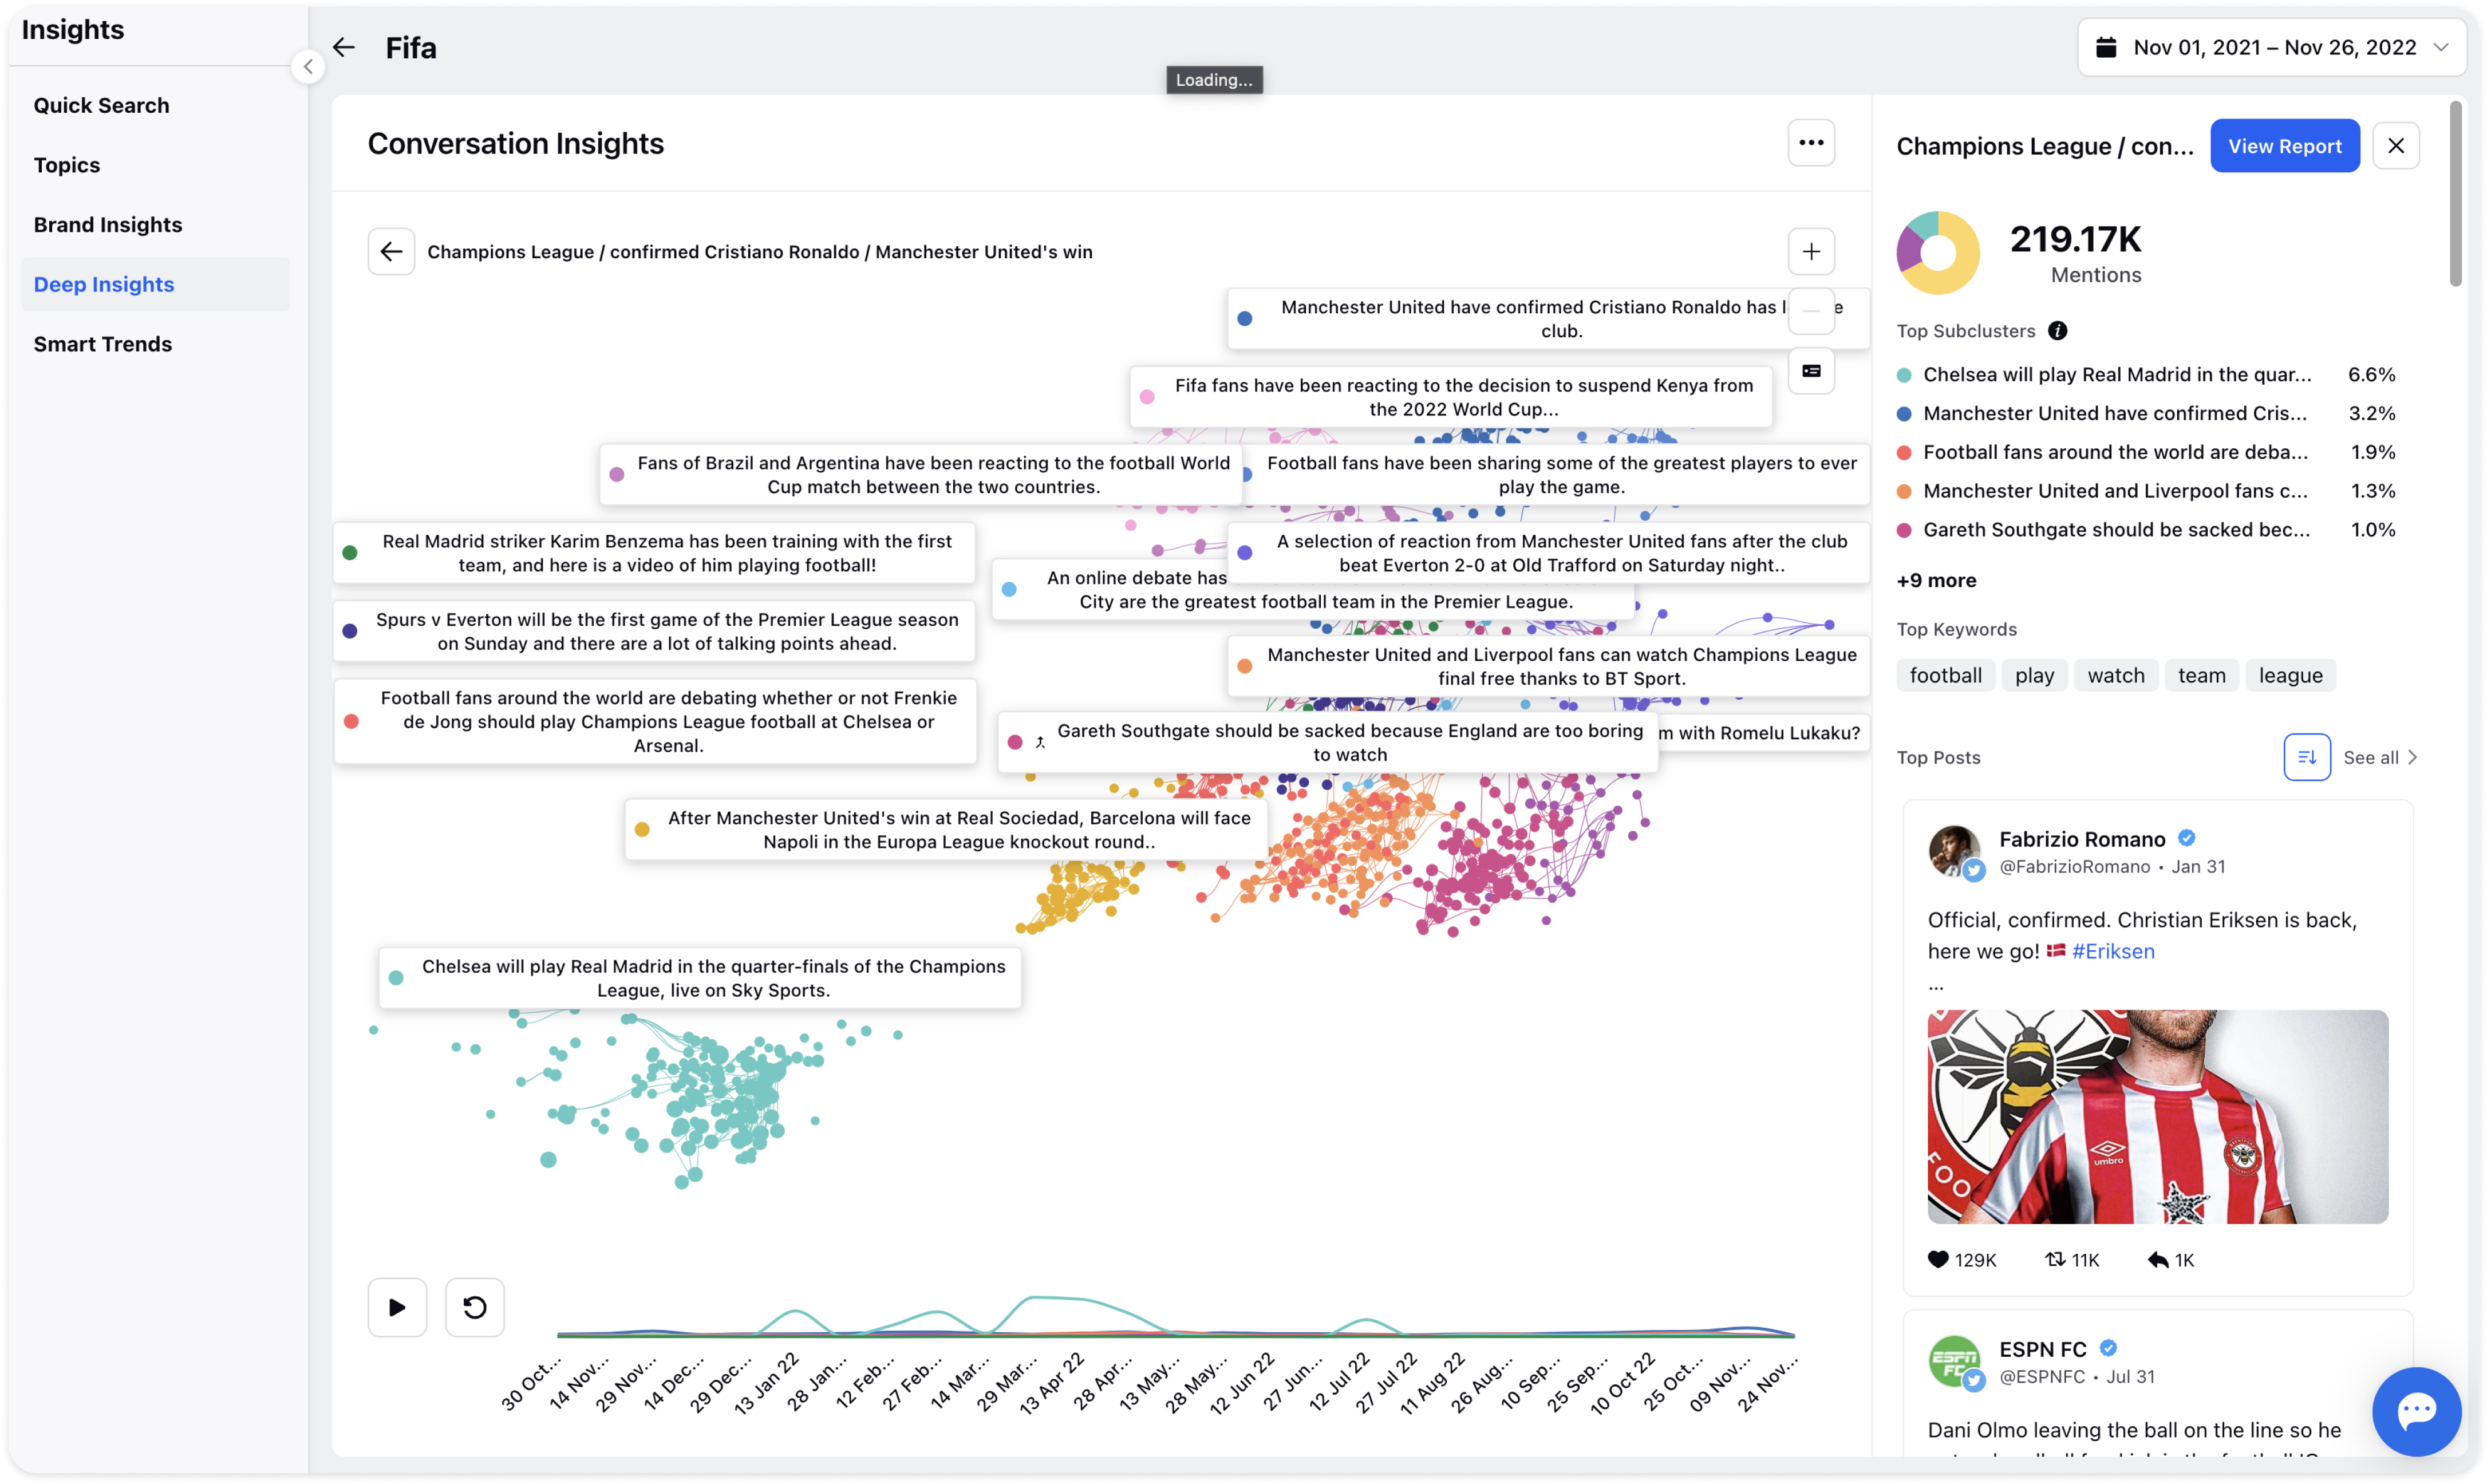
Double-click on the Cluster label to dive deeper
When you double-click on the cluster label, the widget will zoom in to the particular cluster and all the sub-clusters within it will be shown. You can come out of that particular cluster by simply pressing the Esc key or clicking the back button on the widget.
Drag & Reposition labels
You can drag and reposition the labels to place them at the desired location
Right-click on Cluster label
When you right-click on the cluster label, you will see different options like-Highlight: This is similar to single-clicking on the cluster label
Drilldown: This is similar to double-clicking on the cluster label
Rename: Clicking this option will allow you to rename the cluster label
Change Color: Clicking this option will allow you to change the color of the cluster
Merge Clusters: Clicking this option will allow you to merge two or multiple clusters into one. You can select the clusters that you want to merge and then click Merge.abel
Hide/Unhide Cluster: You can hide clusters that seem irrelevant to your analysis for reporting purposes. Clicking the Hide Cluster option will hide the cluster from the cluster map widget, right-pane, and deep-dive dashboard. To view the list of hidden clusters, click the Unhide Clusters button placed below the Zoom icons. You can unhide any cluster by clicking the Unhide button against the hidden clusters' names
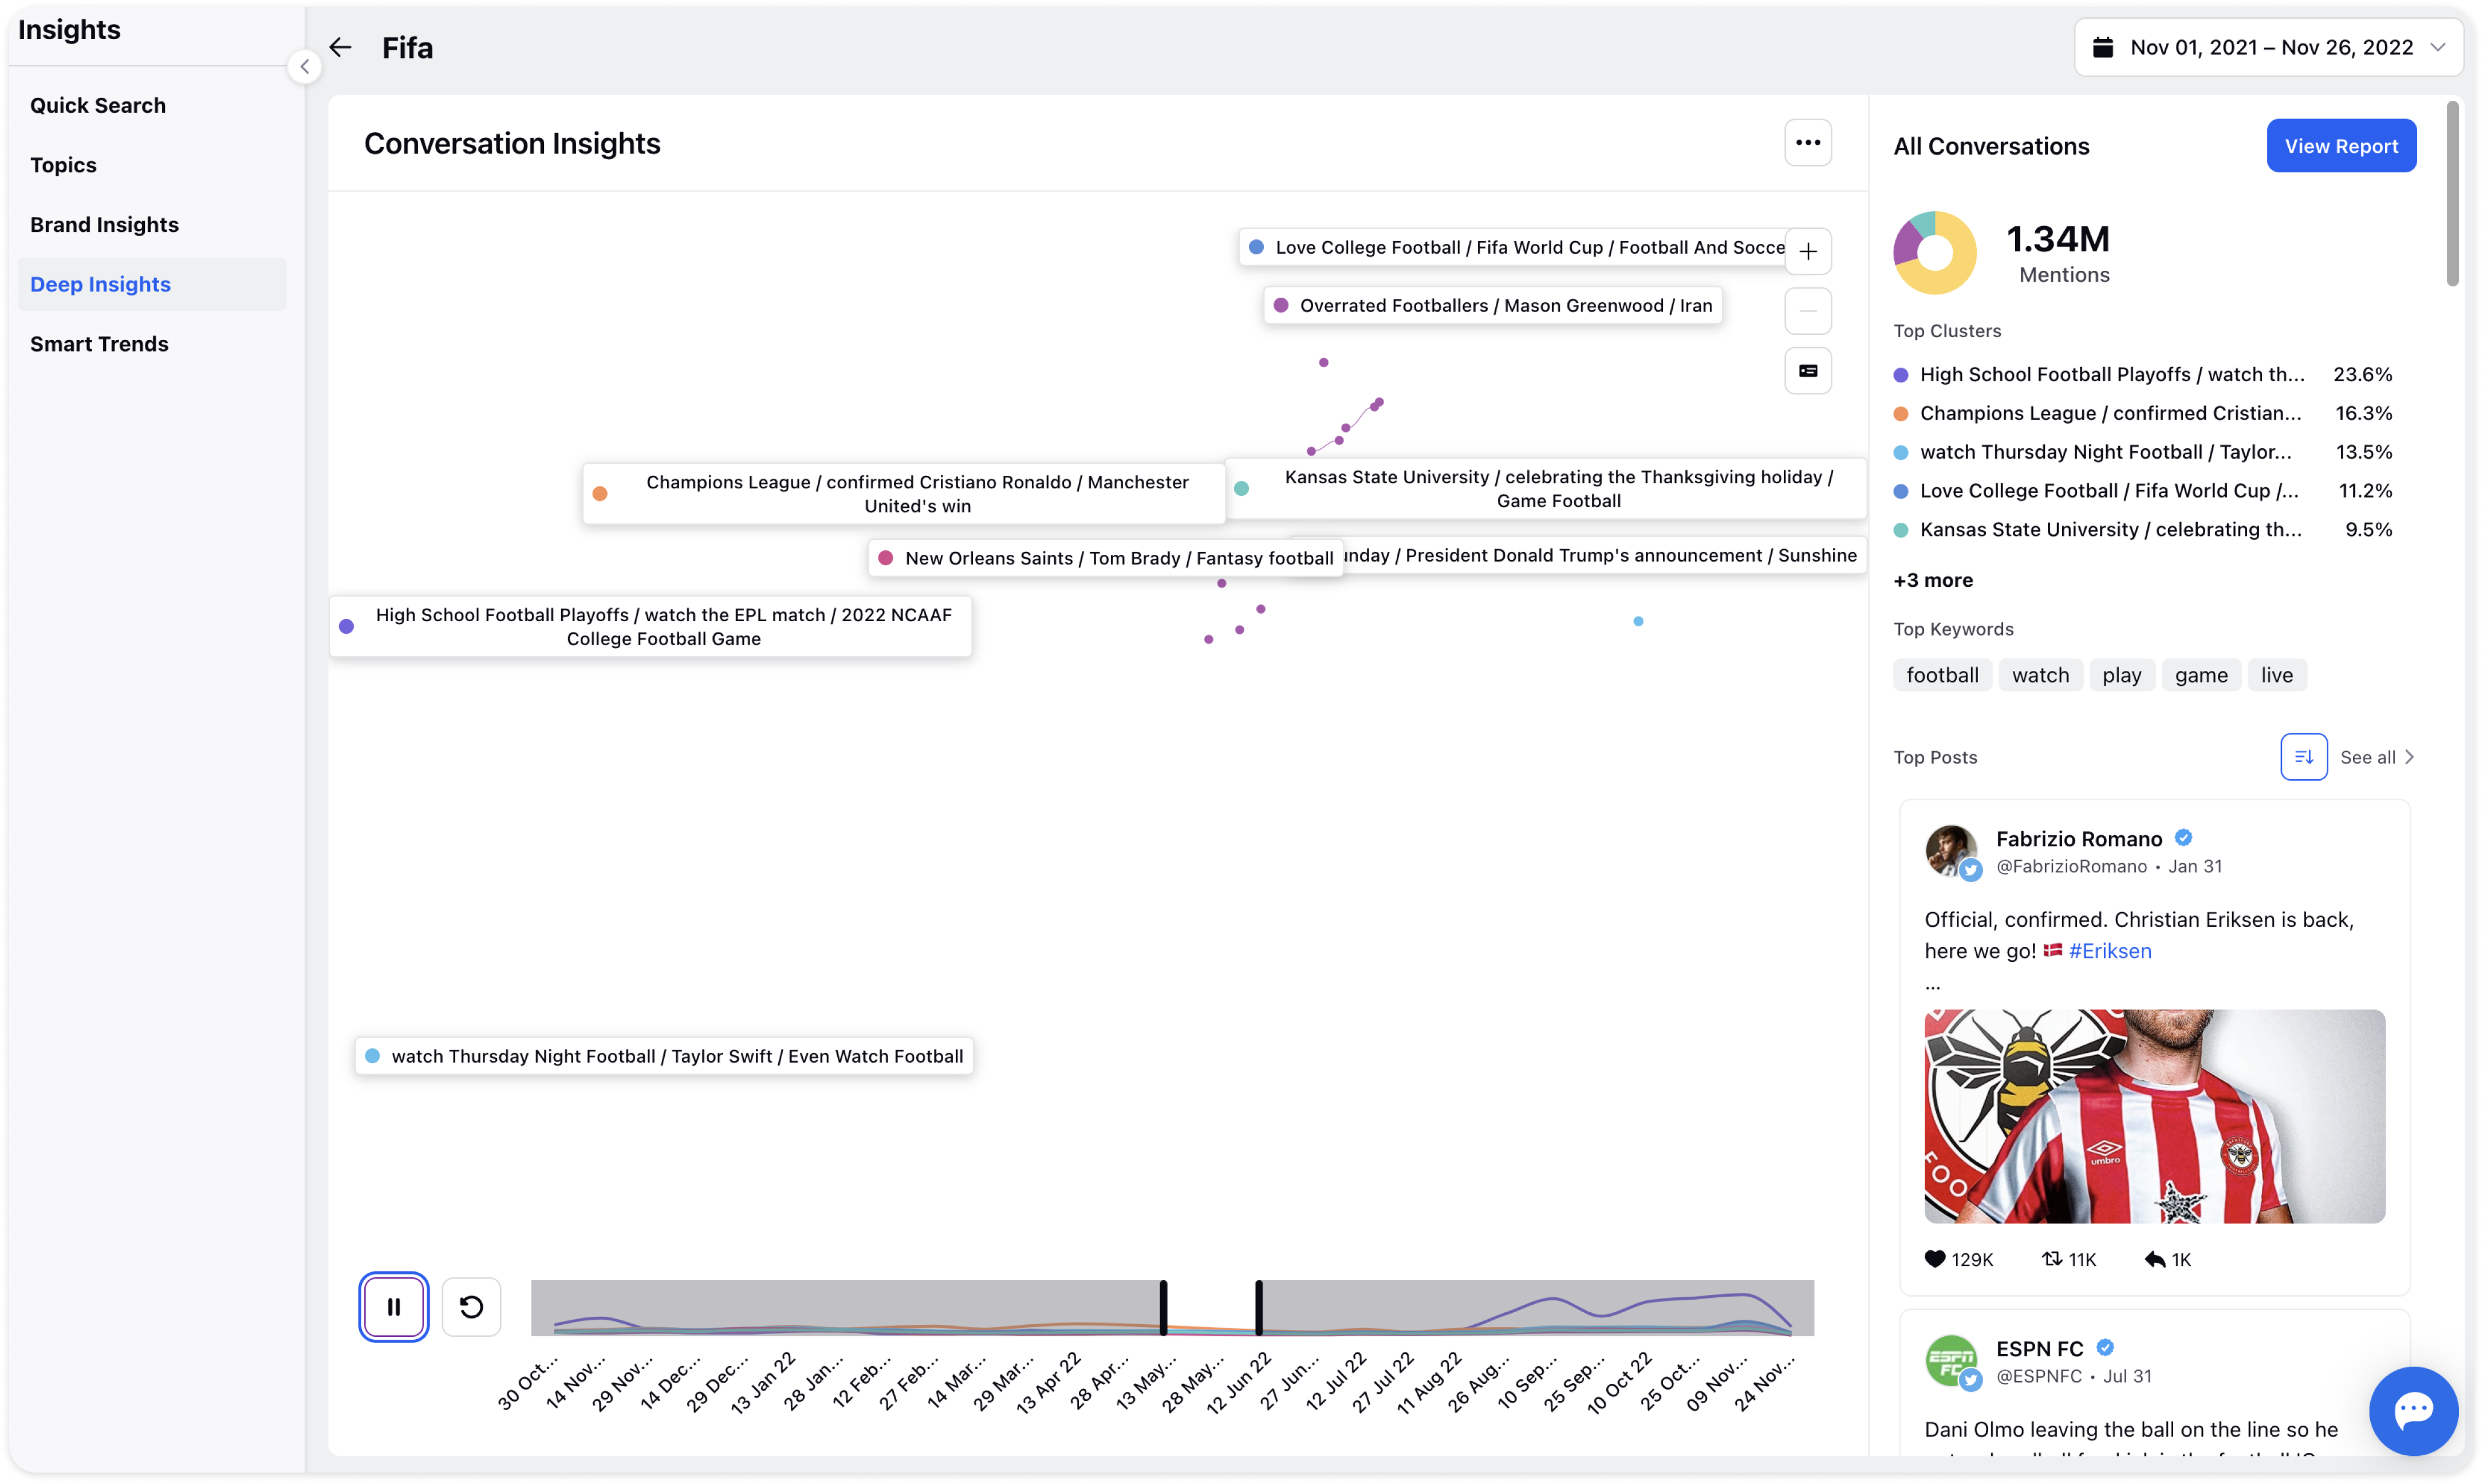
Time lapse
The time-lapse feature allows you to track the growth of individual clusters/sub-clusters and how the relationships between them change over time.
As you press Play, the time-lapse will start - with the time window beginning to move. As the window moves, you will see how the conversation clusters were at the instant of time & how they gradually changed over the full duration.
A volume chart of mentions for each cluster is also shown to identify when conversation pertaining to a particular cluster is peaked.
It consists of the following elements:
Play/Pause Button: You can control the time-lapse using the play/pause button to start or pause it
Time Selector Window: The time selector window is an interactable window that can be moved, played, or paused on the time range. The size of this window is pre-set according to the total time duration of the report
Reset Button: Reset button will reset the window to the default state - start of the total time duration
Volume Charts: Volume charts over time for each cluster shown in the graph are also displayed.
Deep Insights in Sprinklr Insights is an exceptional tool that enables you to capture customer experience measurements and insights in real-time. With this all-in-one platform, you can easily gather valuable data and analyze it to gain insights into your customers' needs and preferences. This tool is designed to help you make informed decisions and improve your overall customer experience