LinkedIn Paid Performance Dashboard
Updated
Use the LinkedIn Ads Performance Report to review performance of the LinkedIn paid posts which have published during the publishing period.
Navigate to LinkedIn Paid Performance Report
Log in to Sprinklr Social. On the Sprinklr Social window, click Reports icon on the left pane.
The LinkedIn Ads Performance Report can be found in the Paid Performance section of Sprinklr Social.
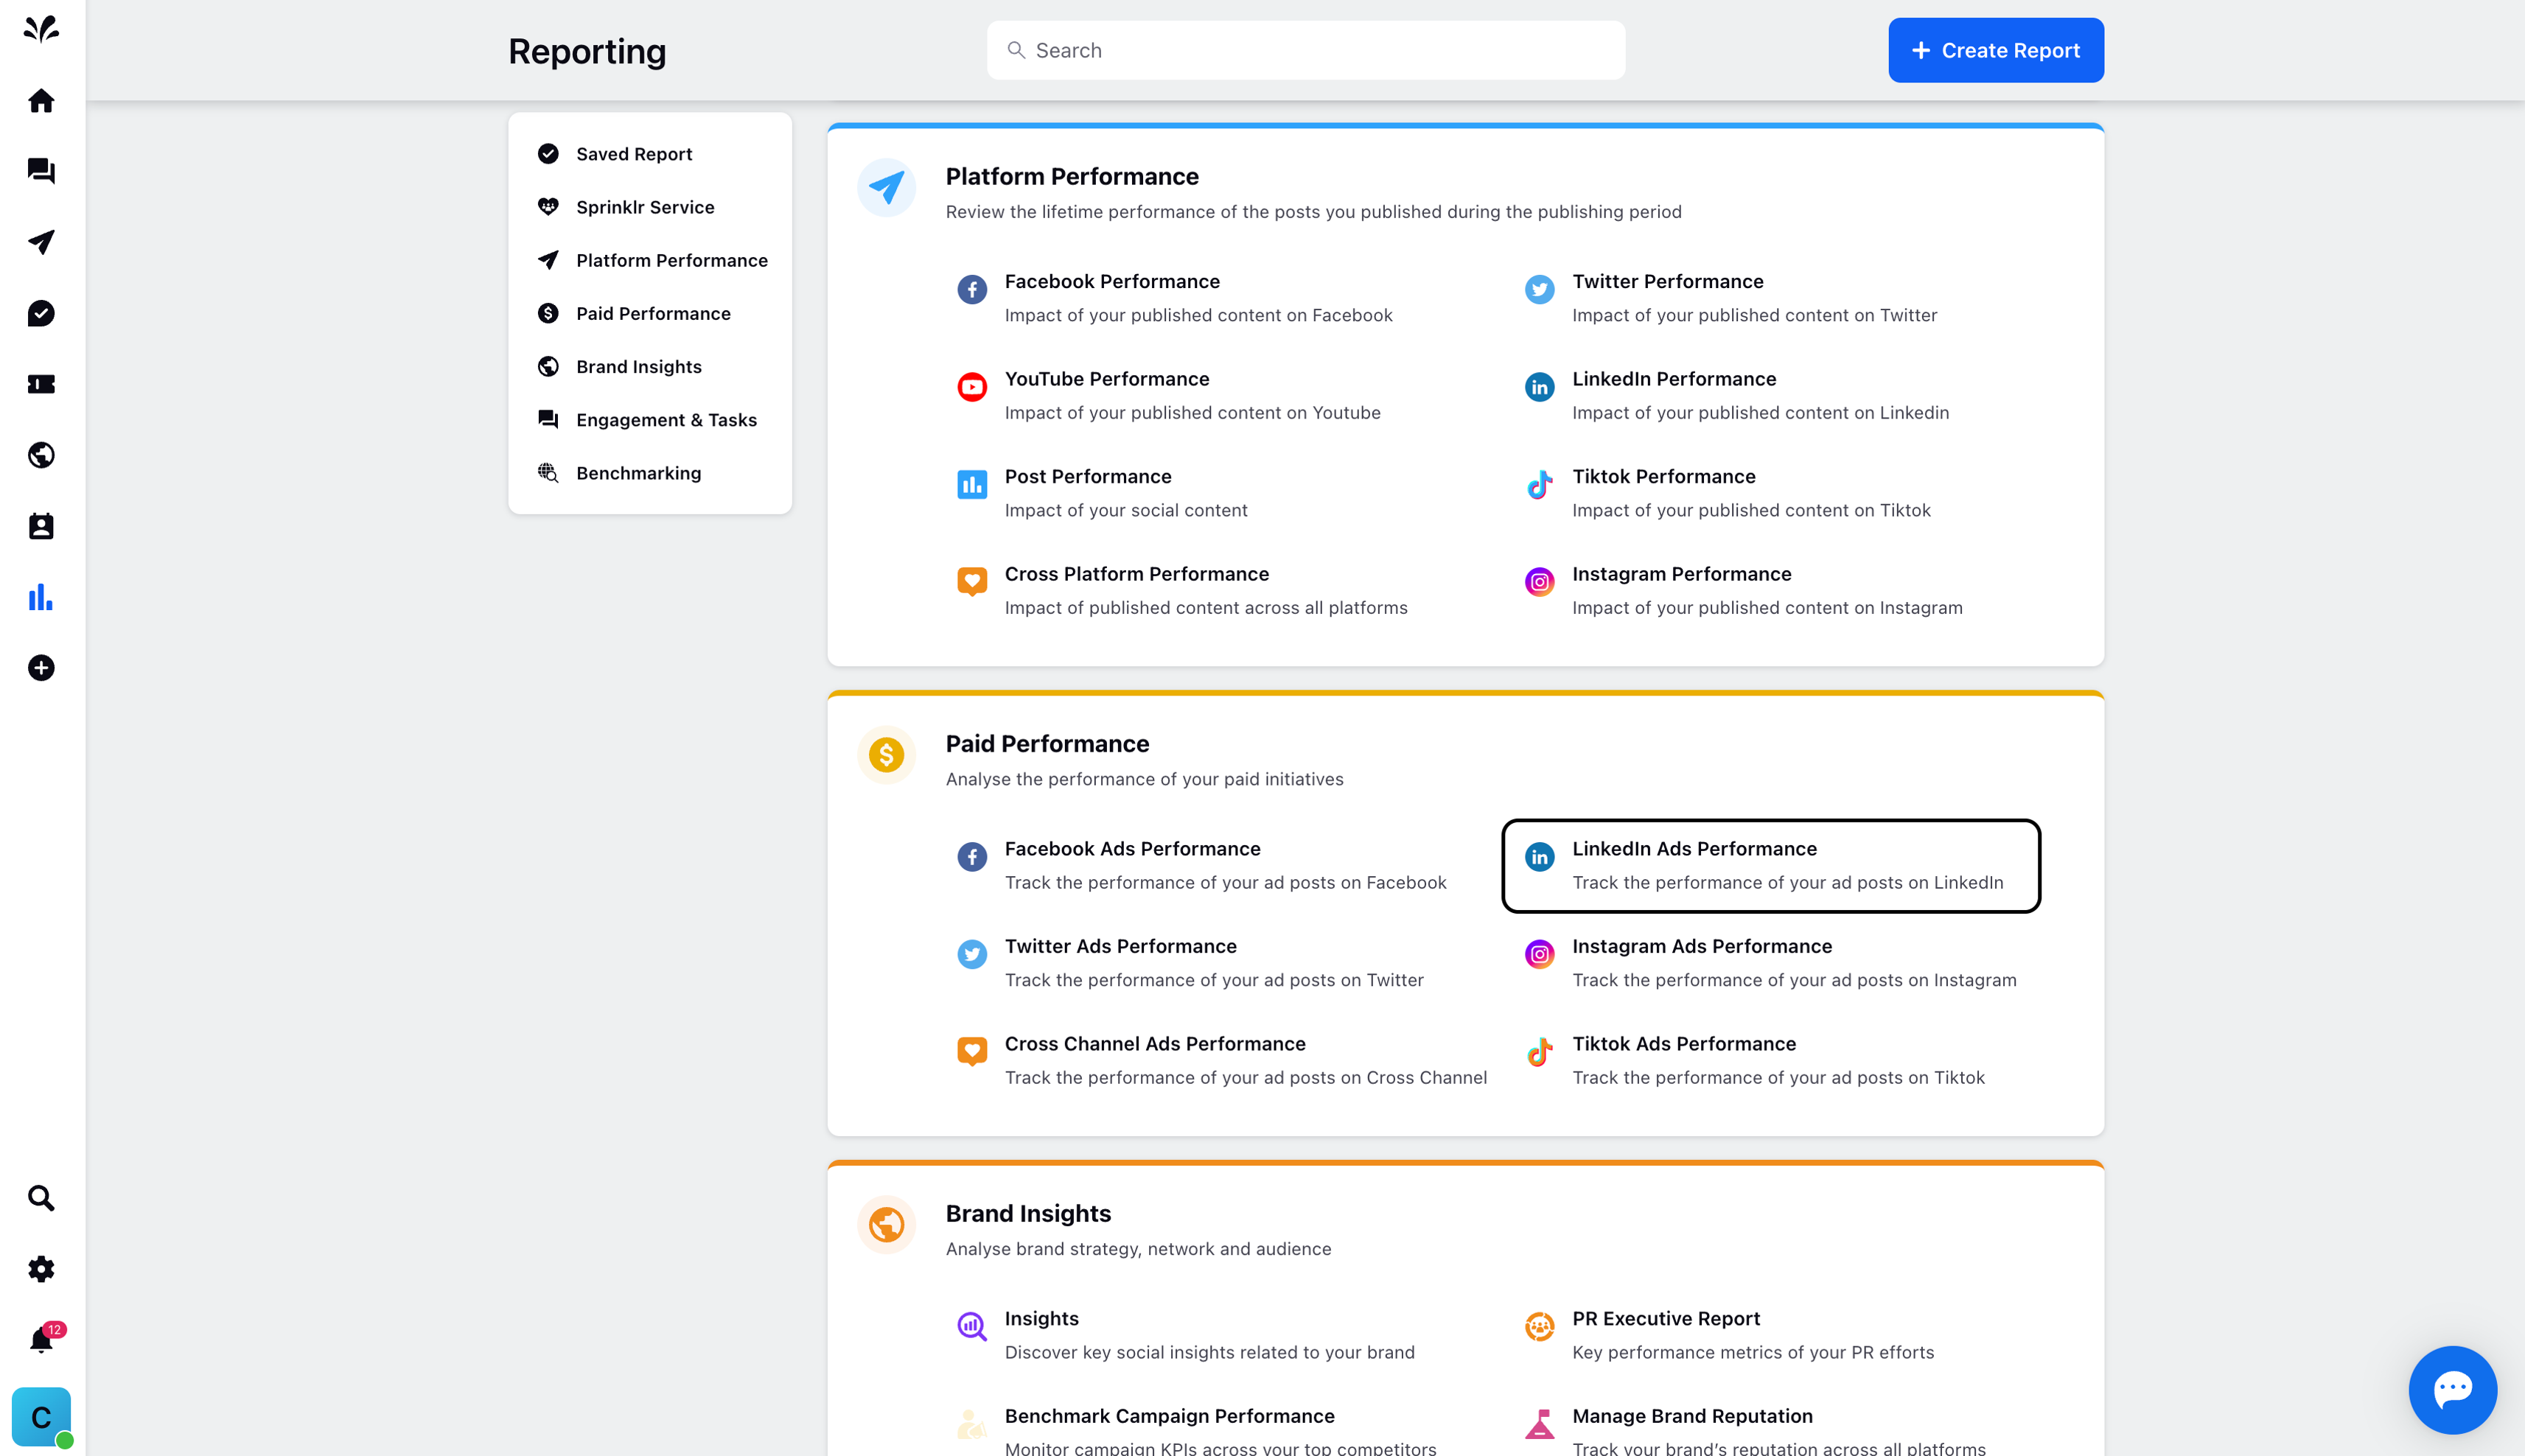
LinkedIn Ads Performance
LinkedIn Ads Performance report have 4 tabs respectively:
Summary
Trends
Campaigns
Audience
Creatives
Here are the detailed description of the above mentioned Tabs:
Summary Tab: This tab consists of following Widgets -
Here are the detailed description of the above mentioned widgets:
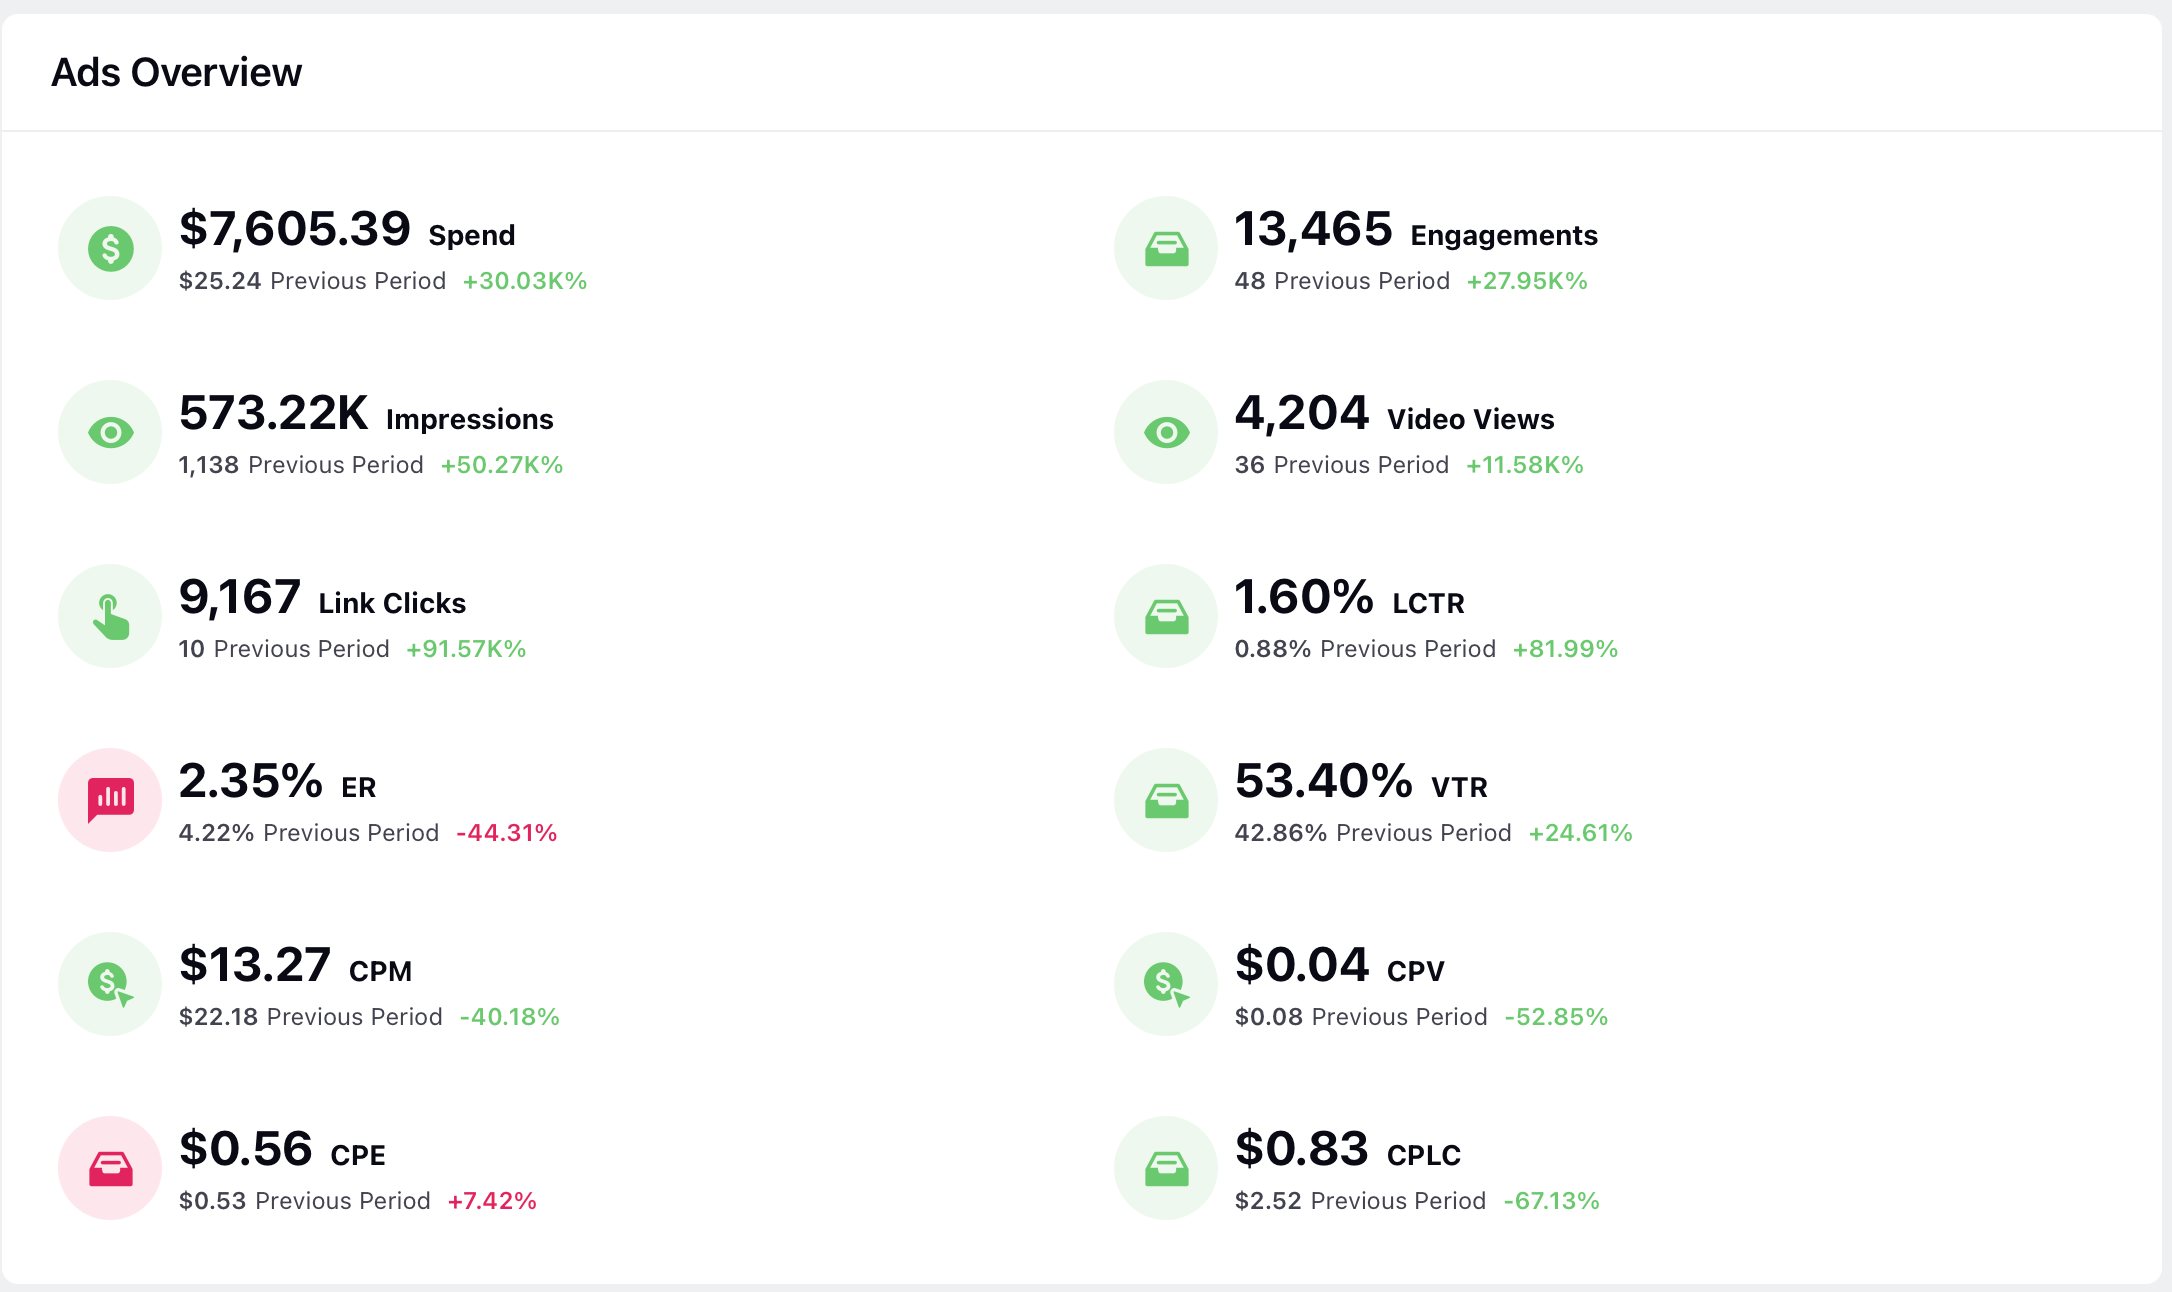
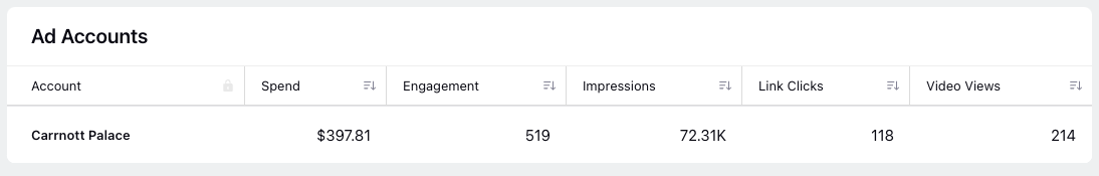
Ads Overview: This widget explains the overall summary of the LinkedIn posts such as Spend, Engagements, Impressions, Video Views, Link Clicks, LCTR, ER, VTR, CPM, CPV, CPE and CPLC. You can click on each of the metrics to view details in the third pane for the current as well as the previous period.
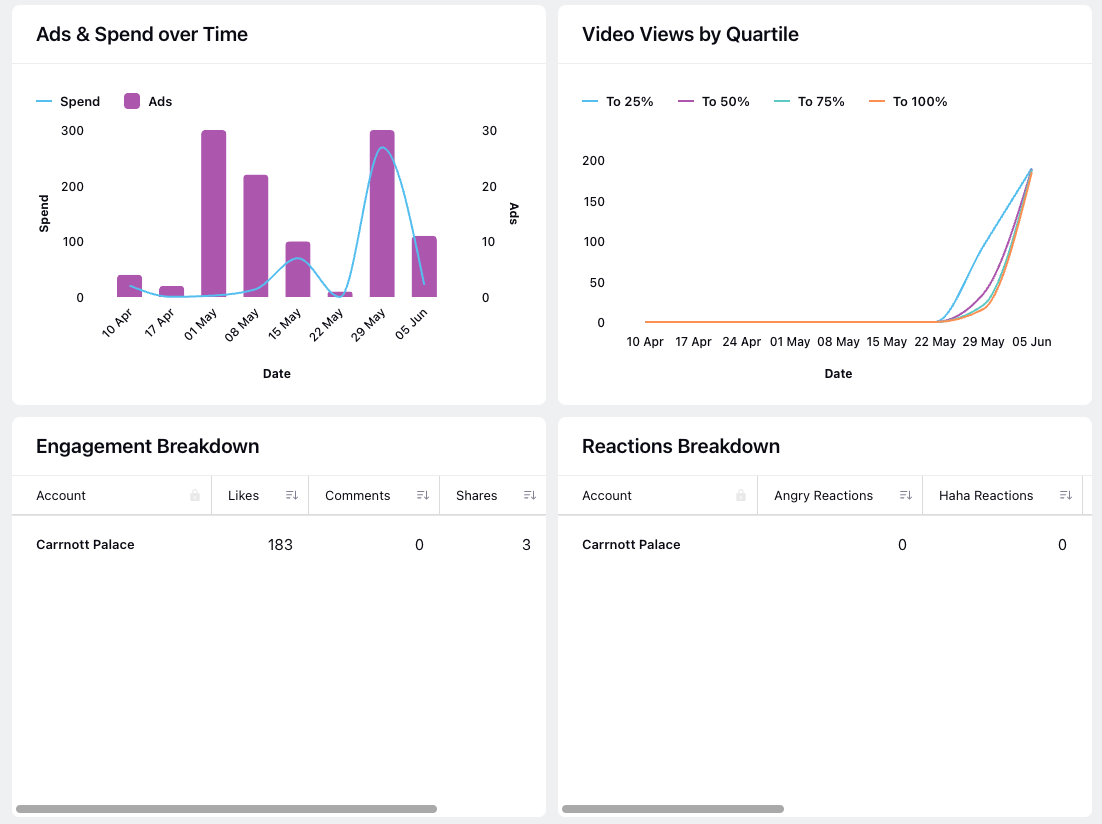
Ads & Spend over Time: This widget explains the relation between published ads and spent over time of the LinkedIn ads. You can click on a particular date to view details in the third pane for the current as well as the previous period.
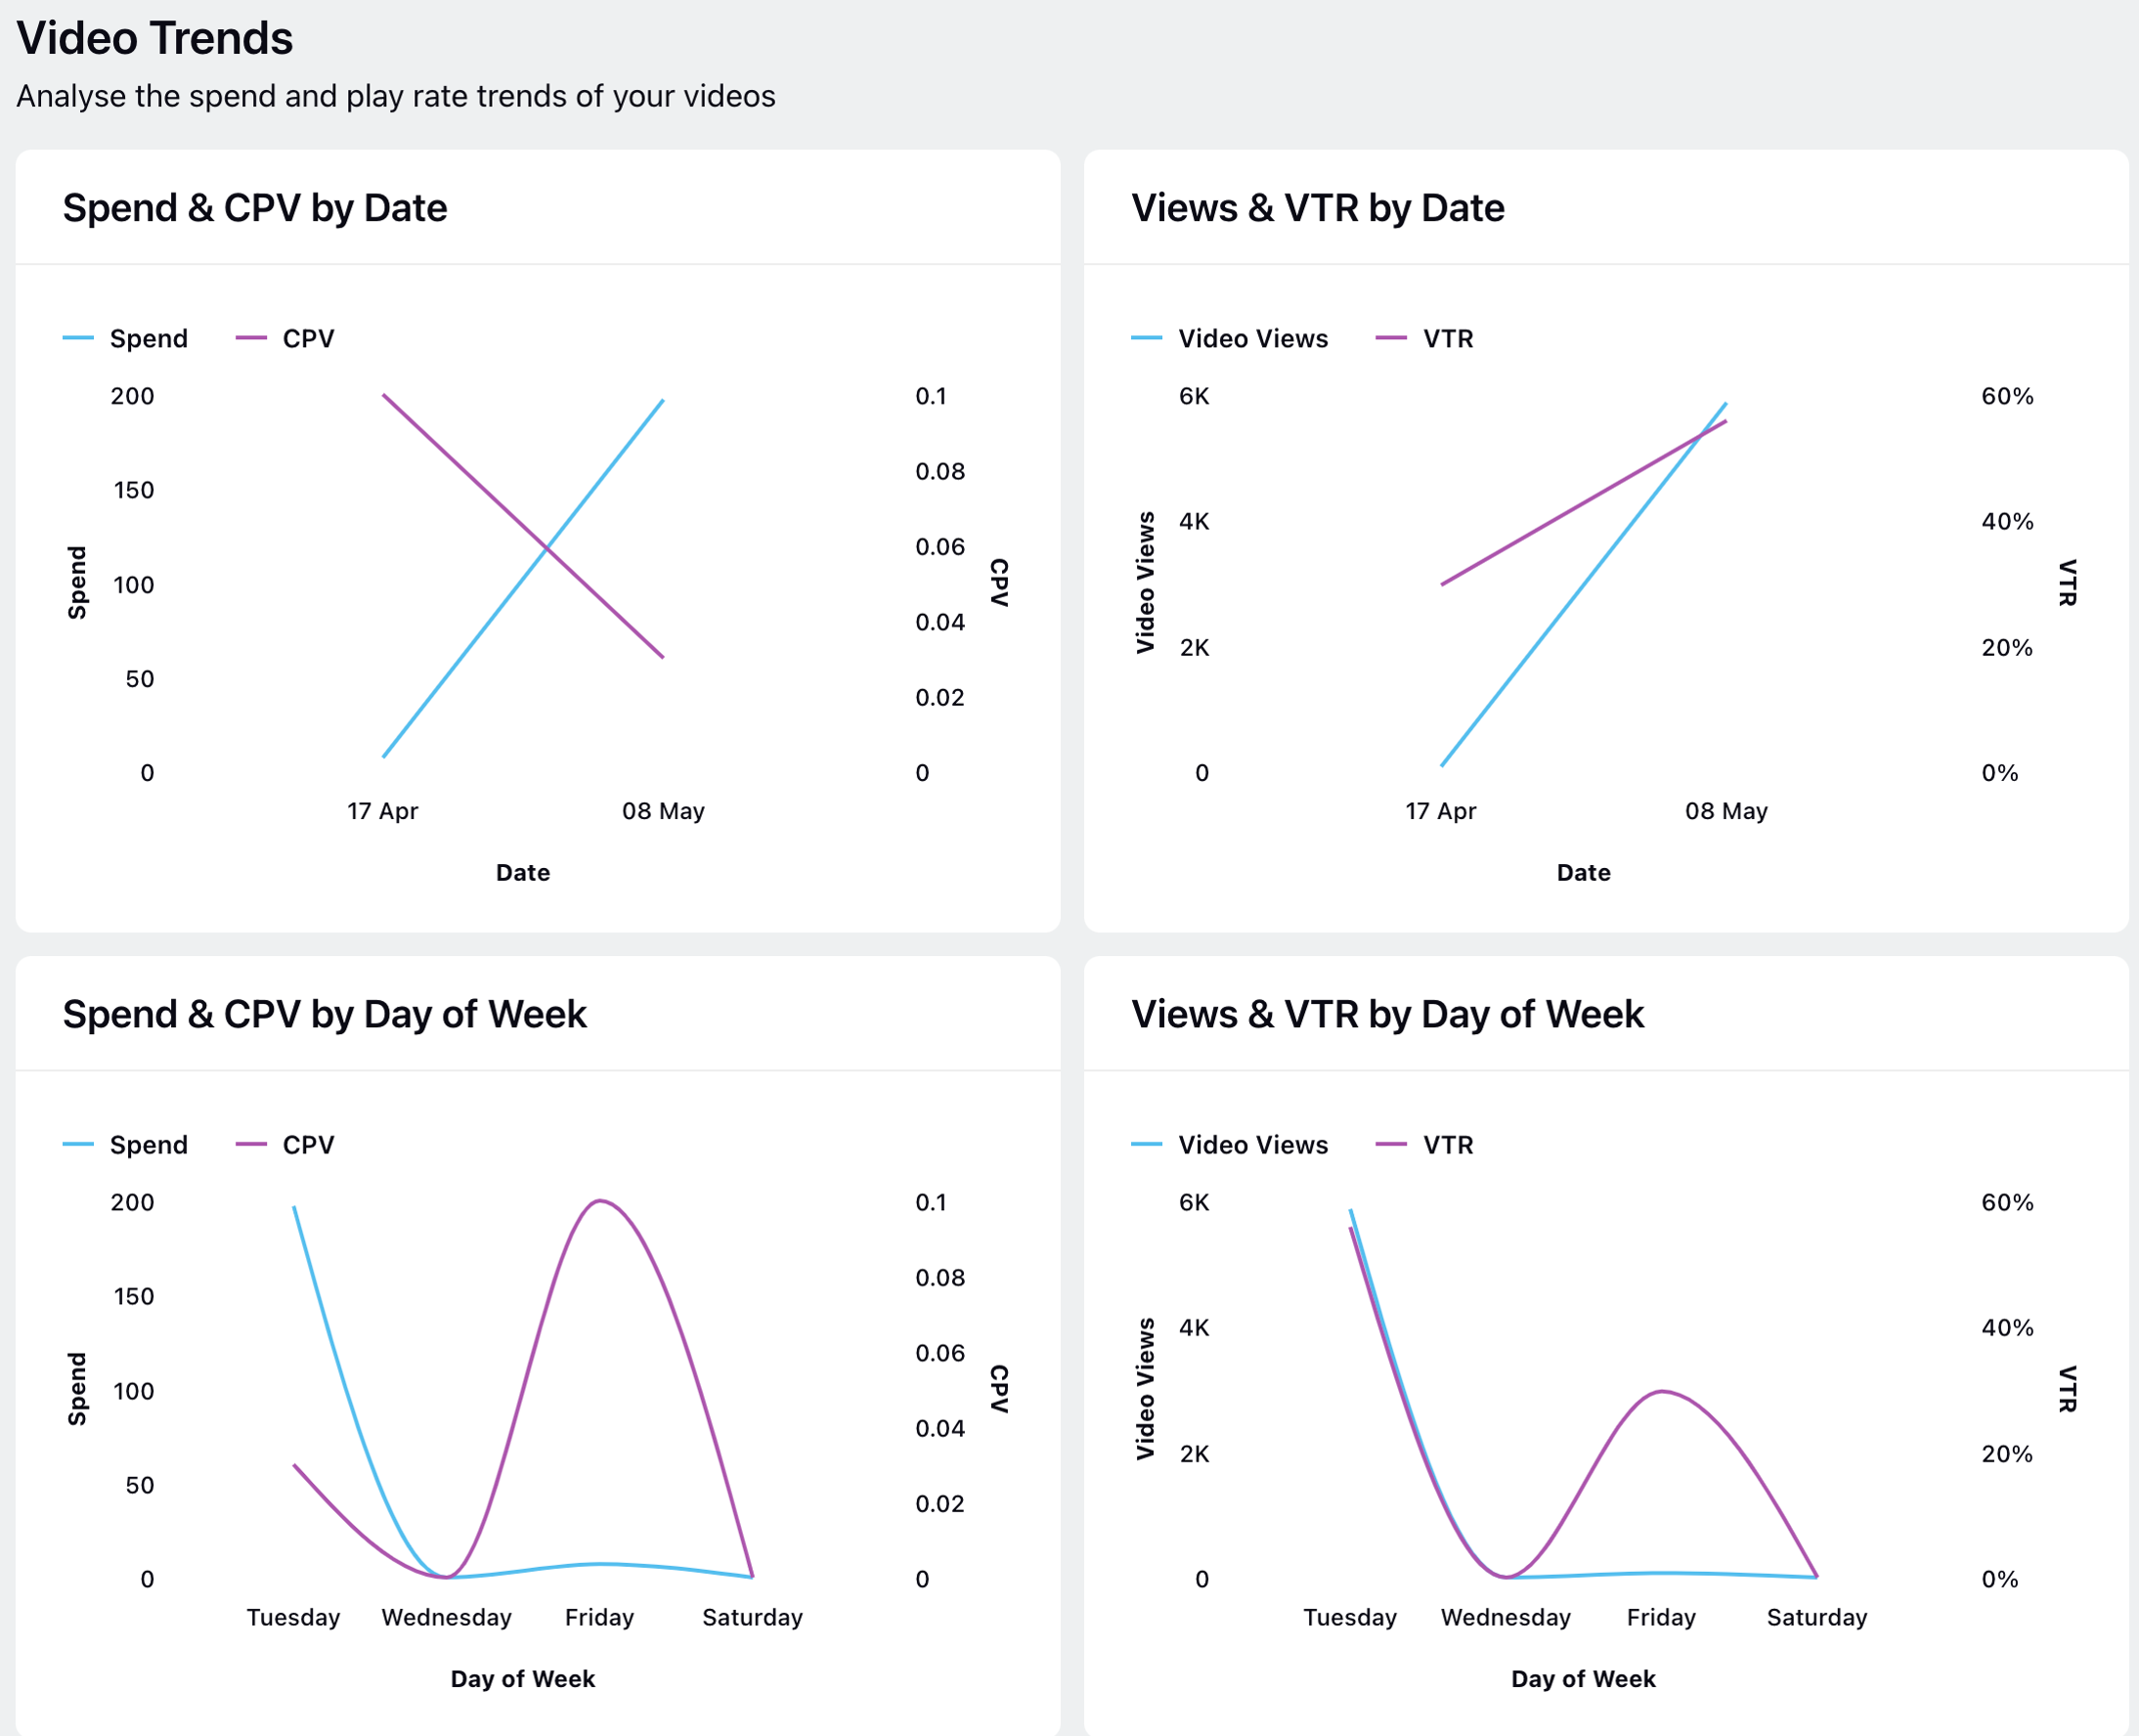
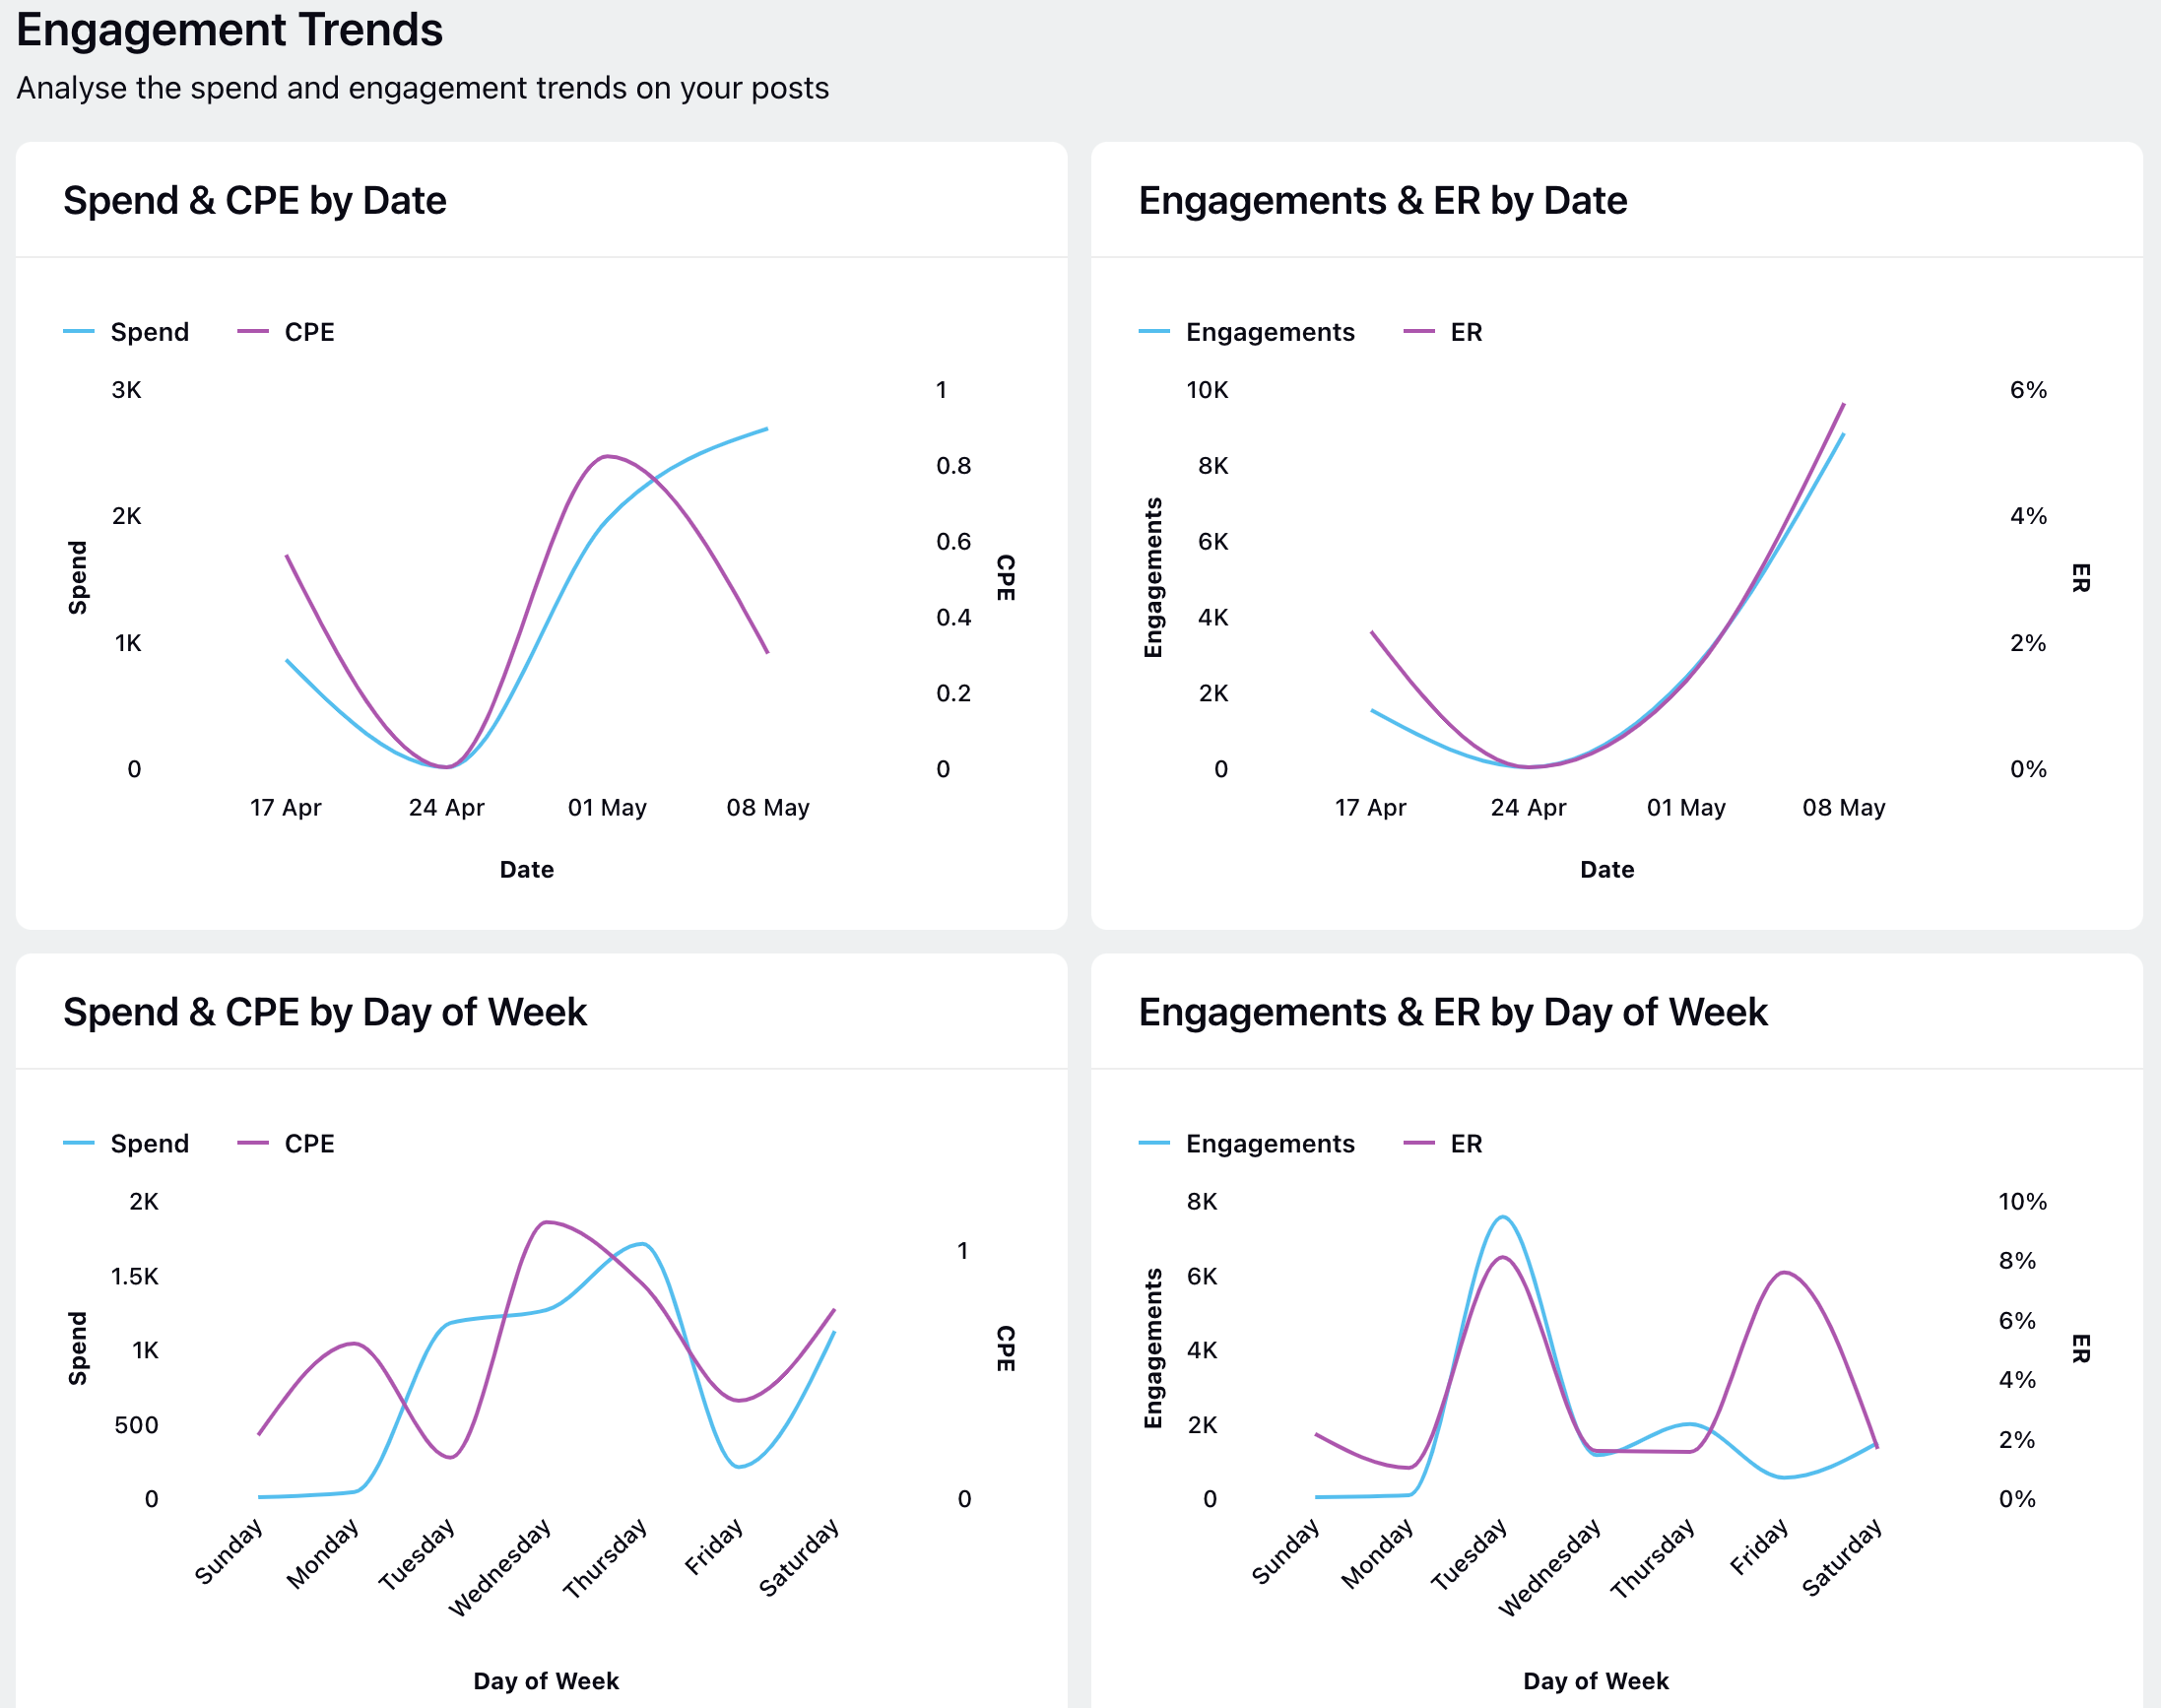
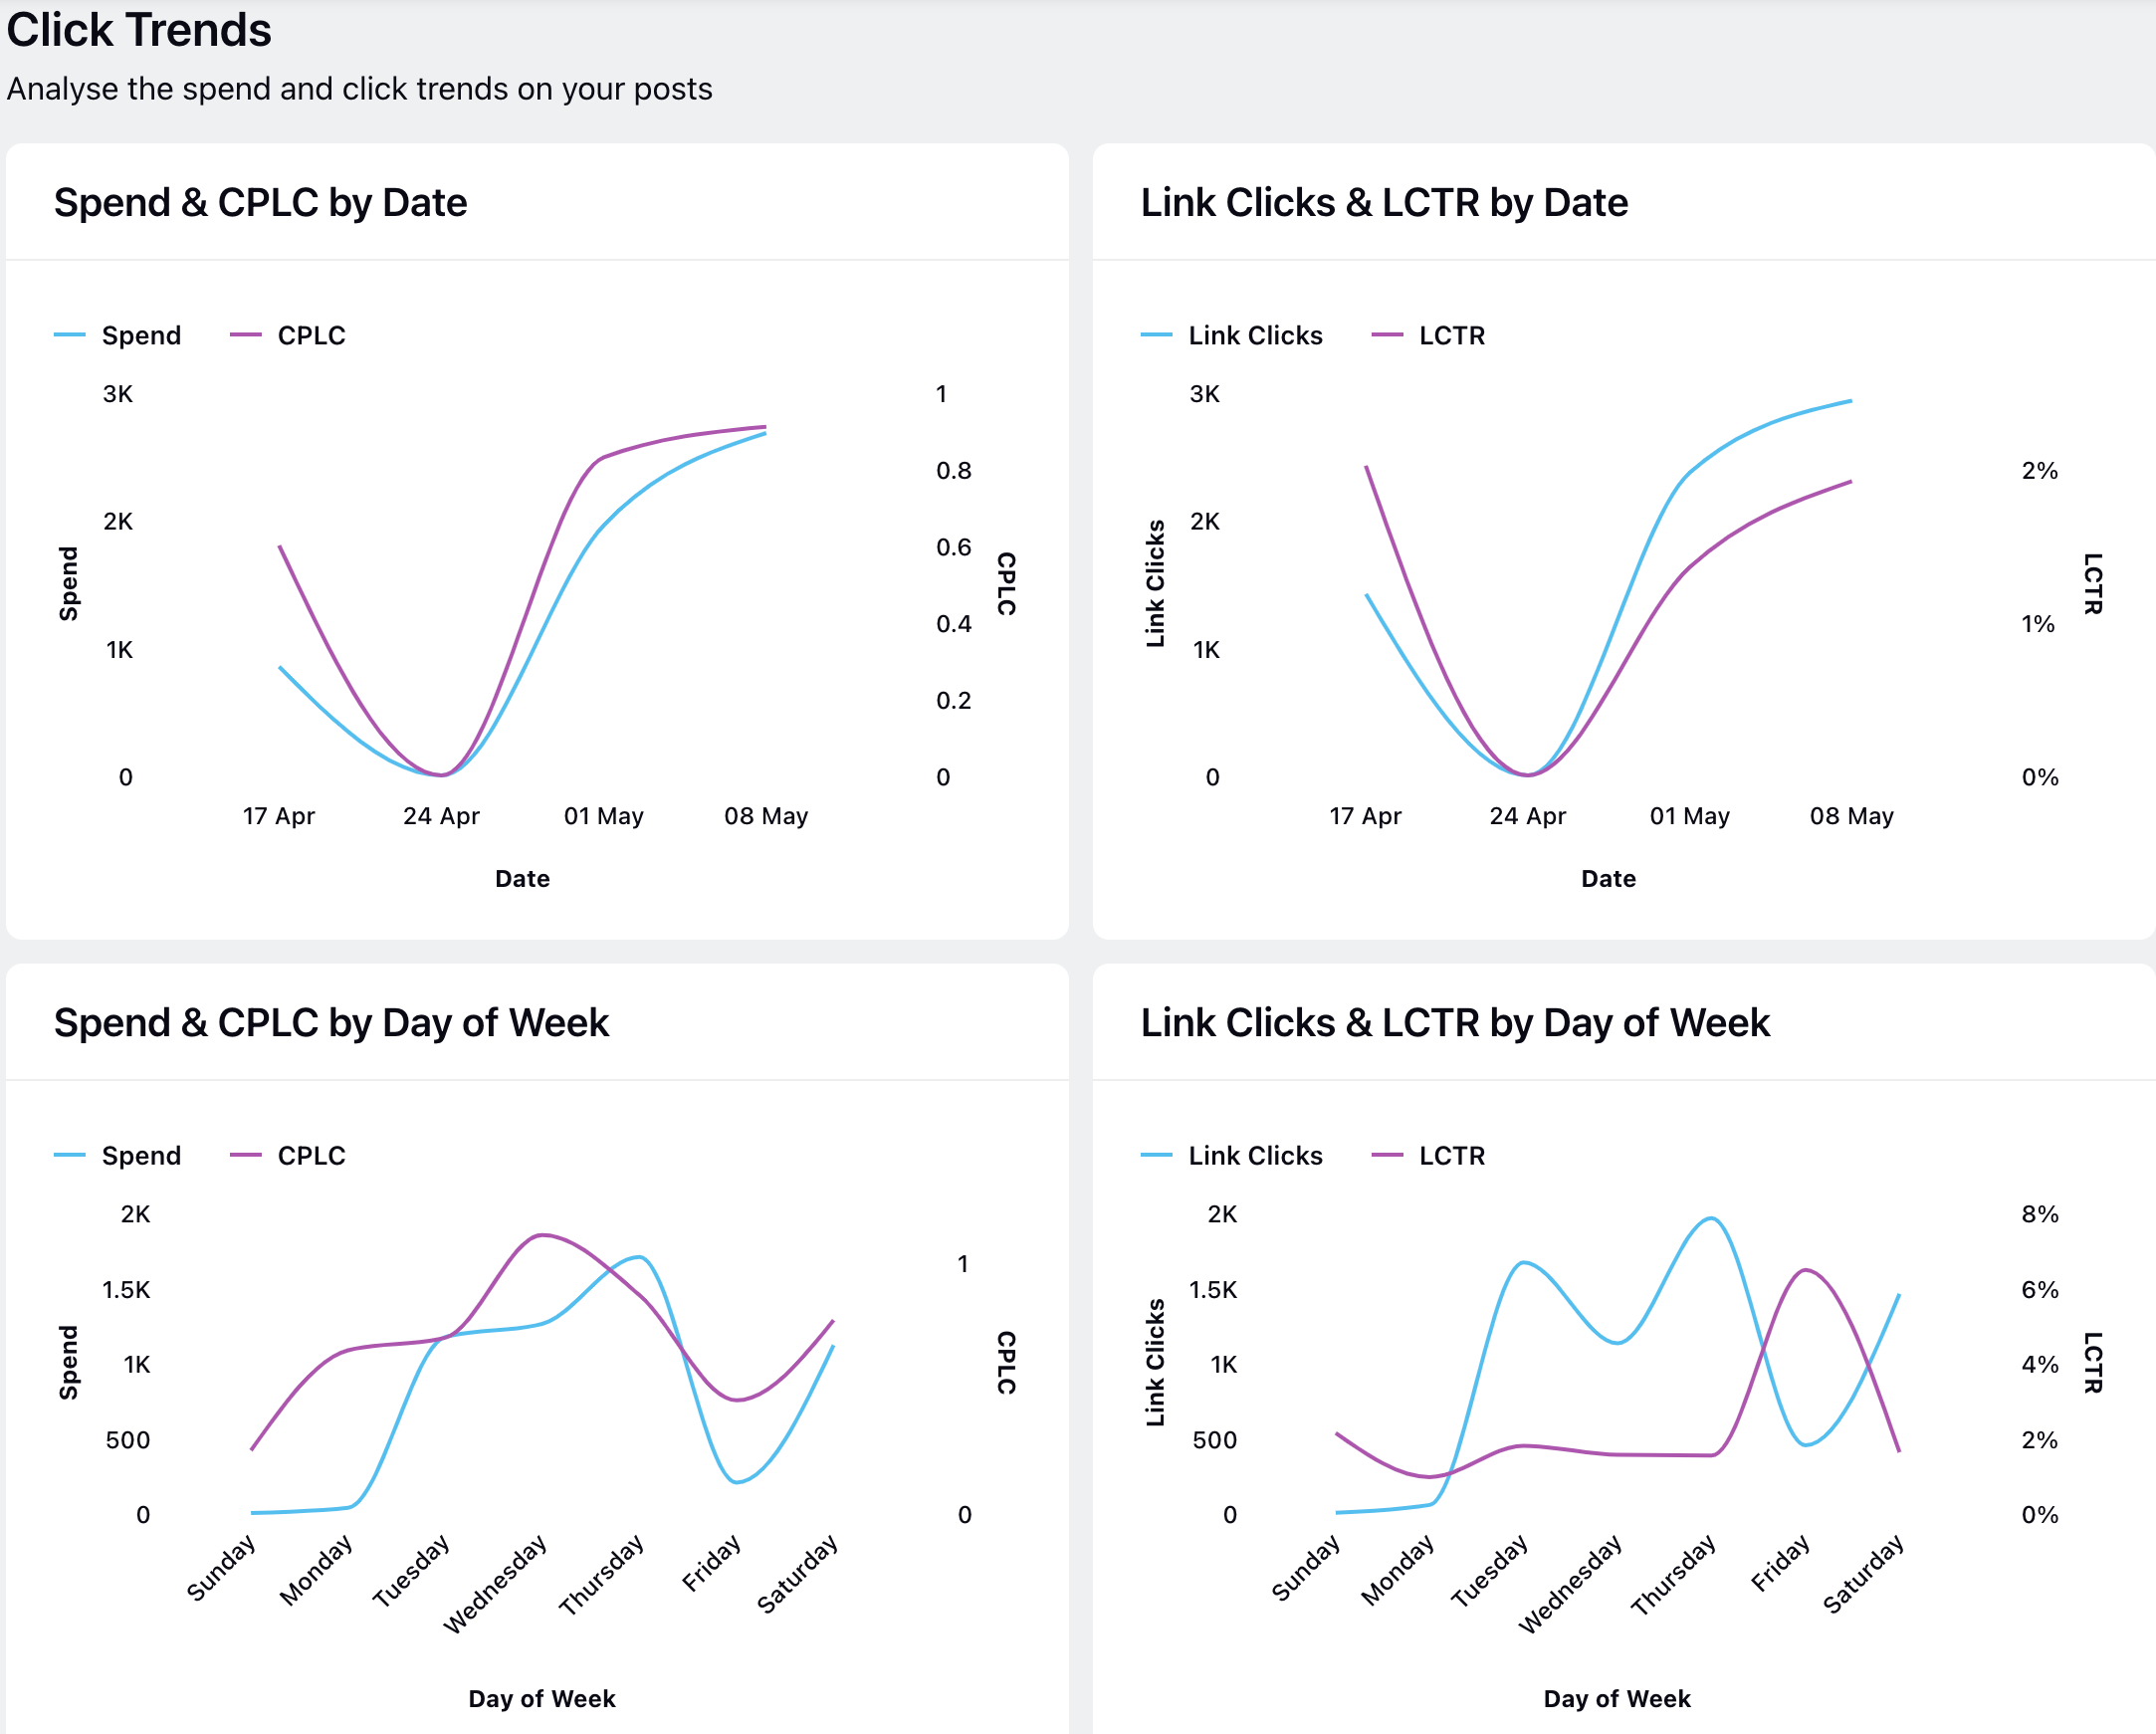
Trends Tab:
Video trends:
Engagement Trends:
Click Trends:
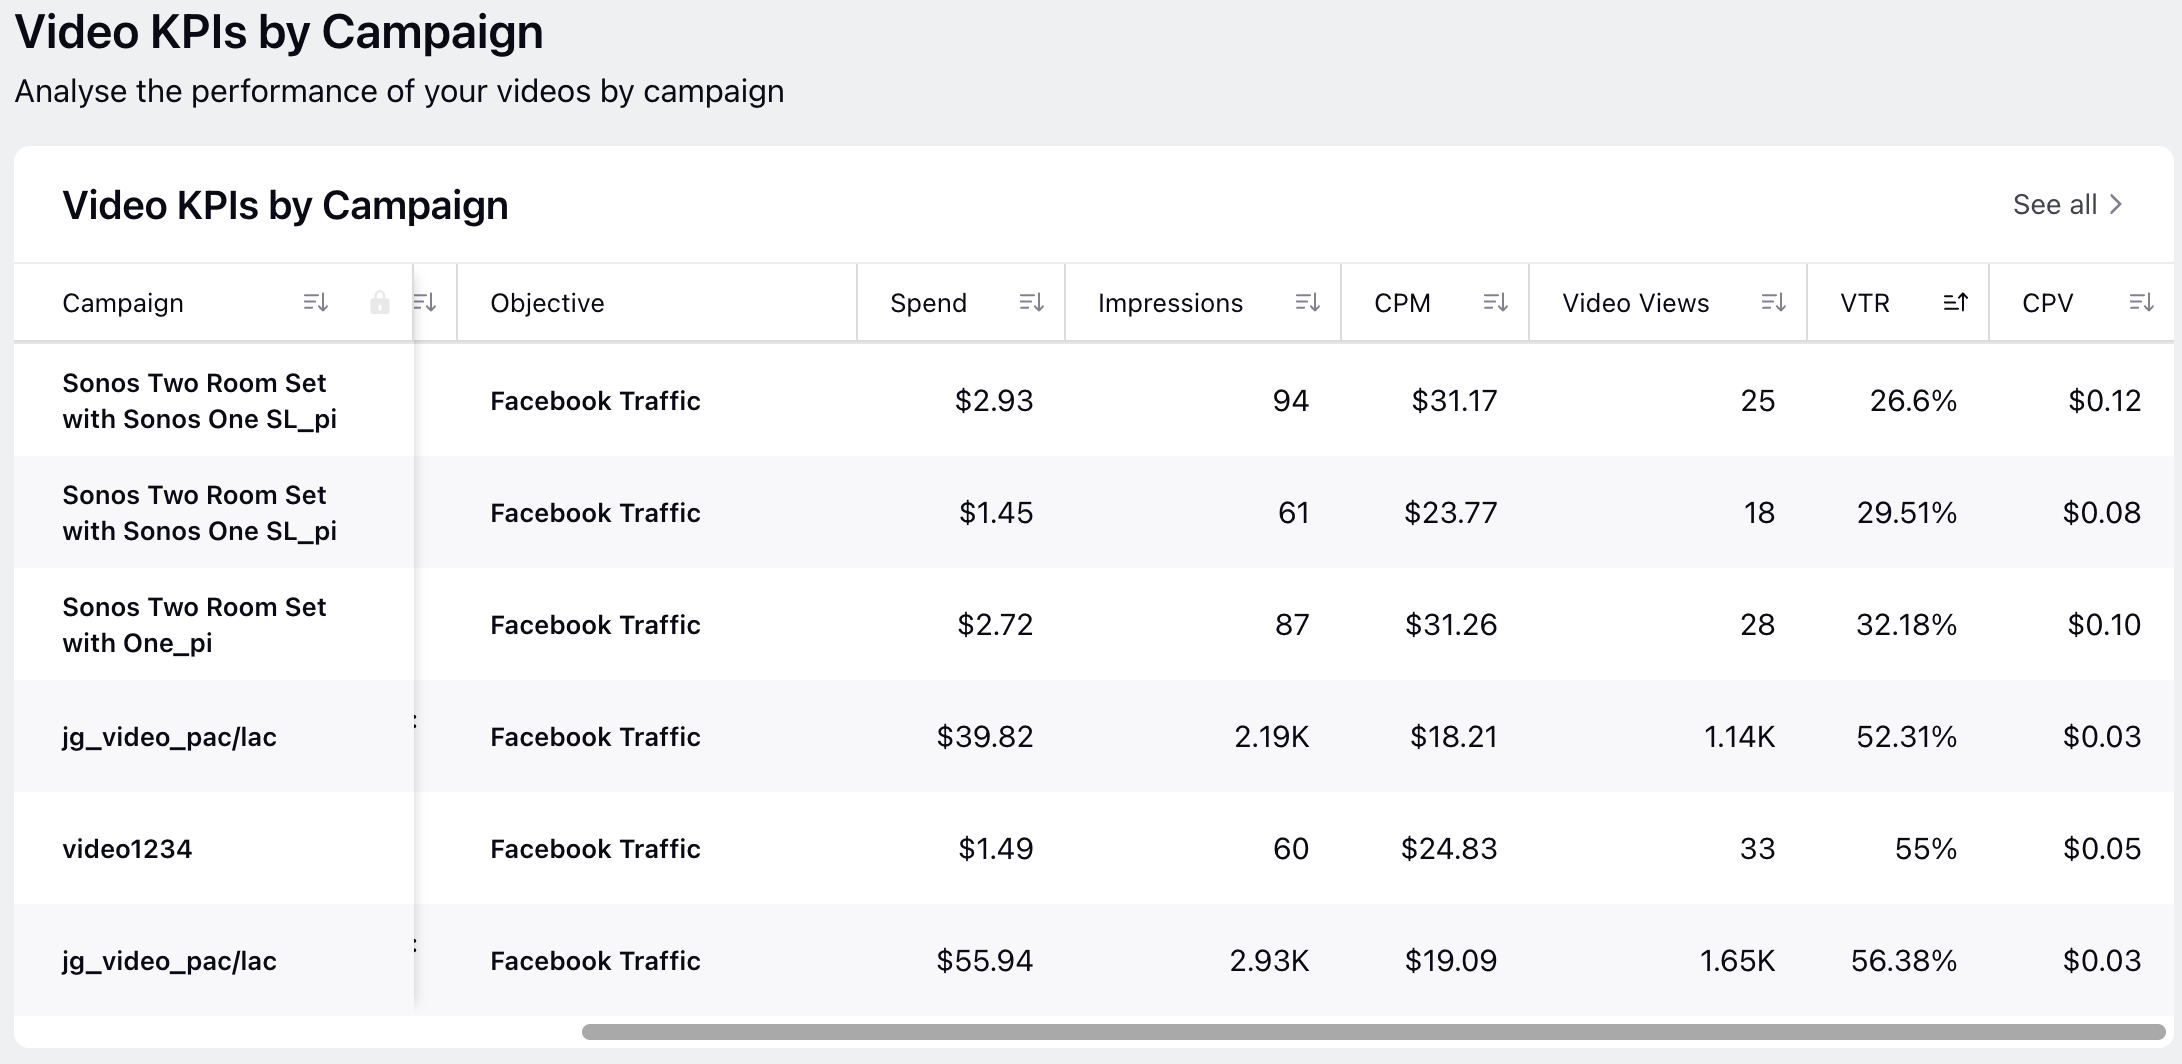
Campaigns Tab:
Video KPIs by Campaign
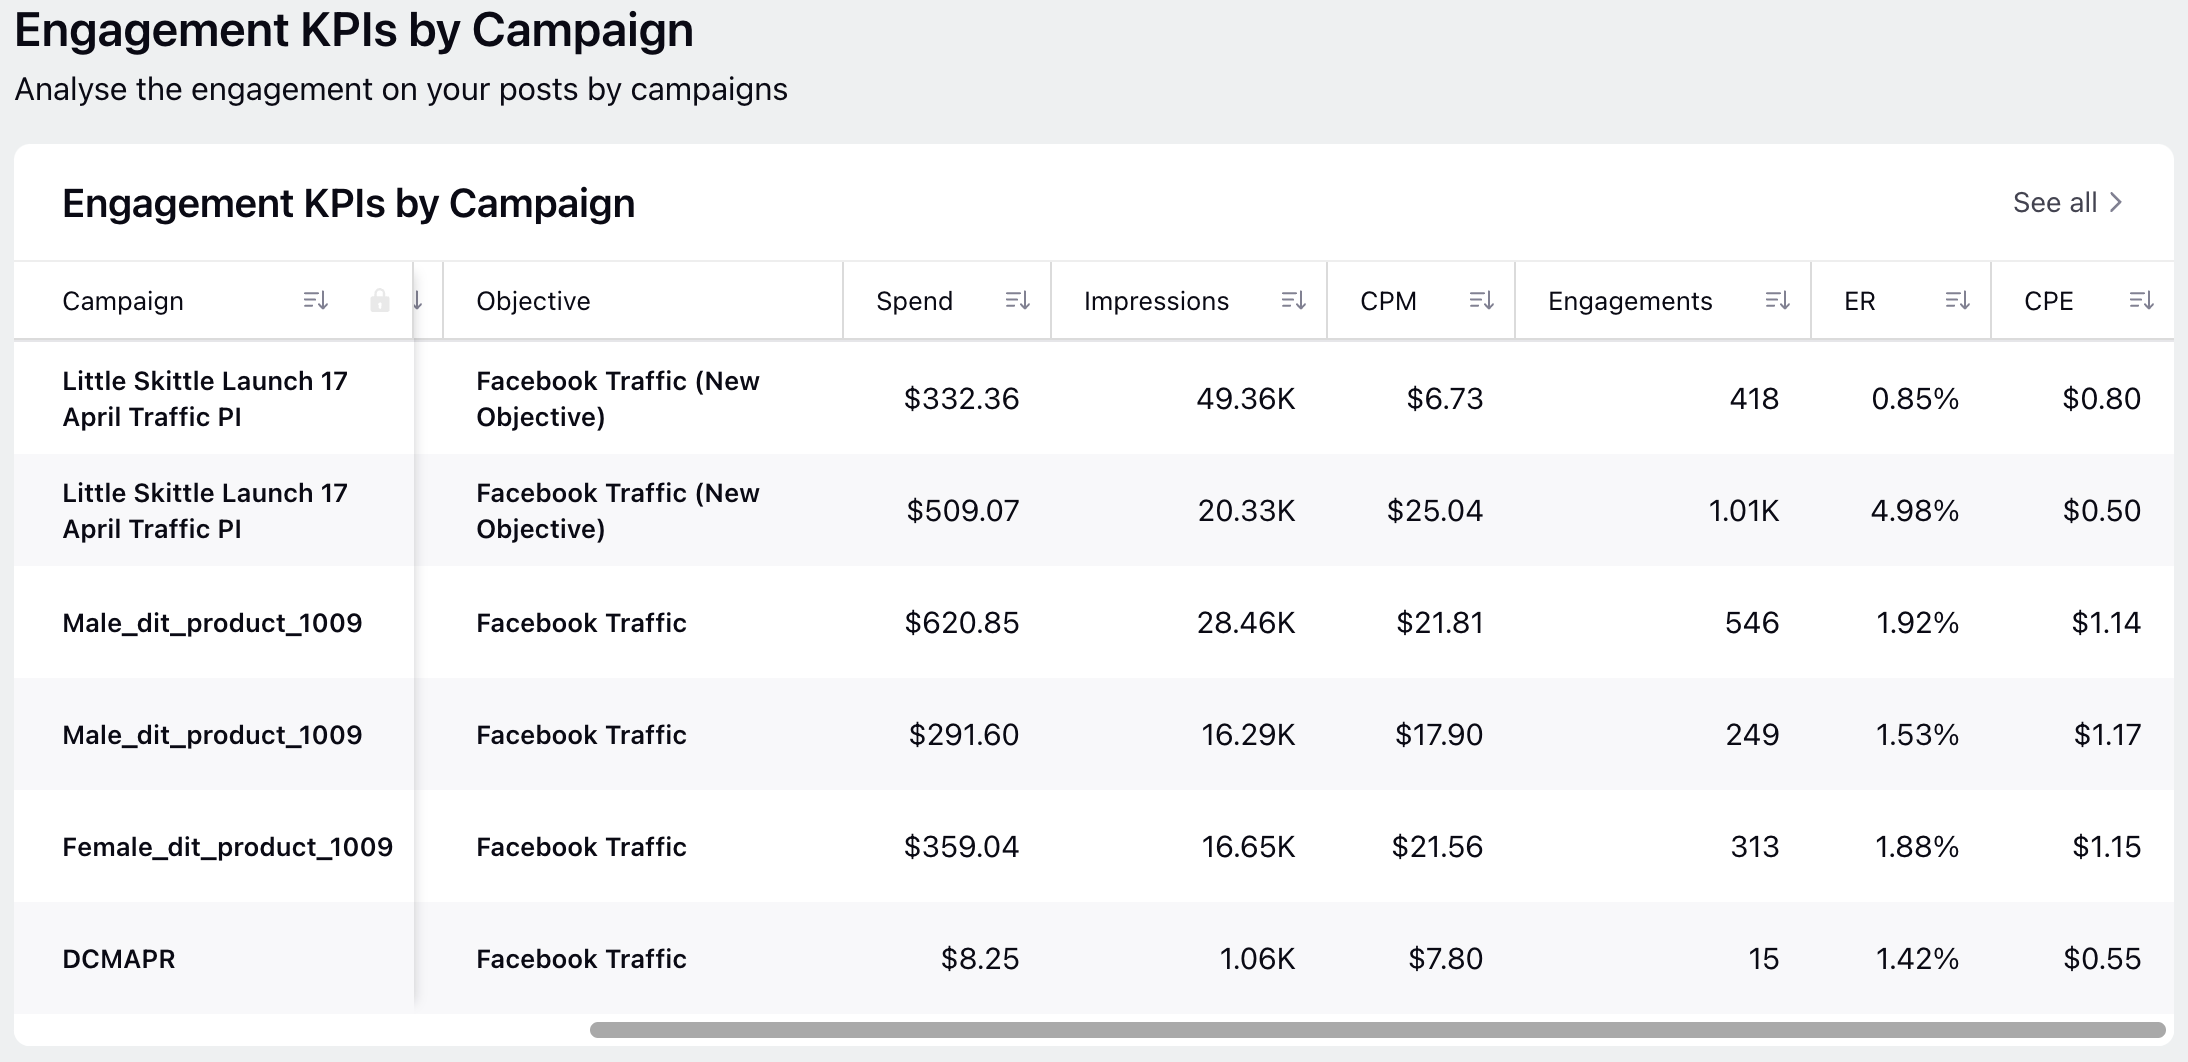
Engagement KPIs by Campaign
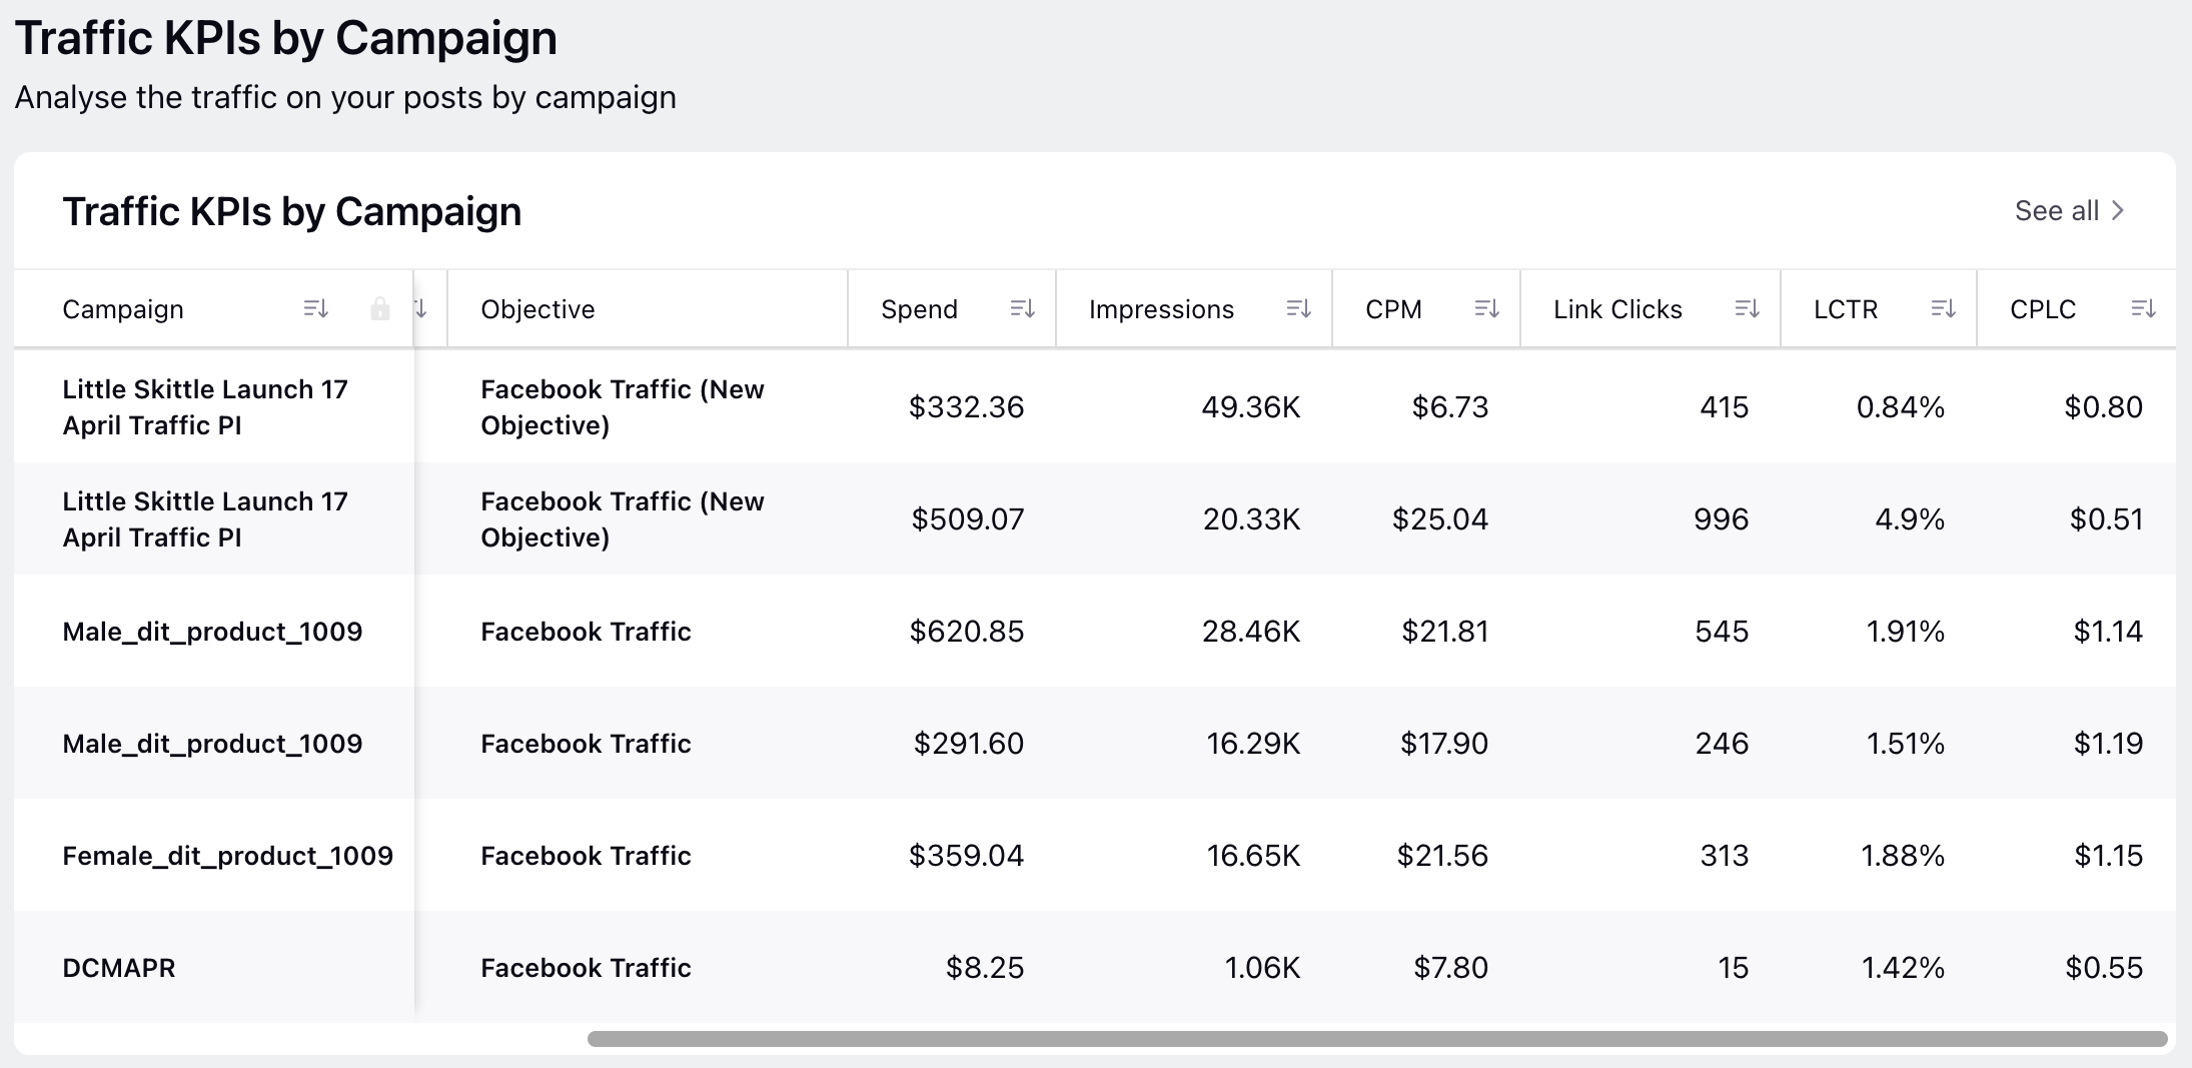
Traffic KPIs by Campaign
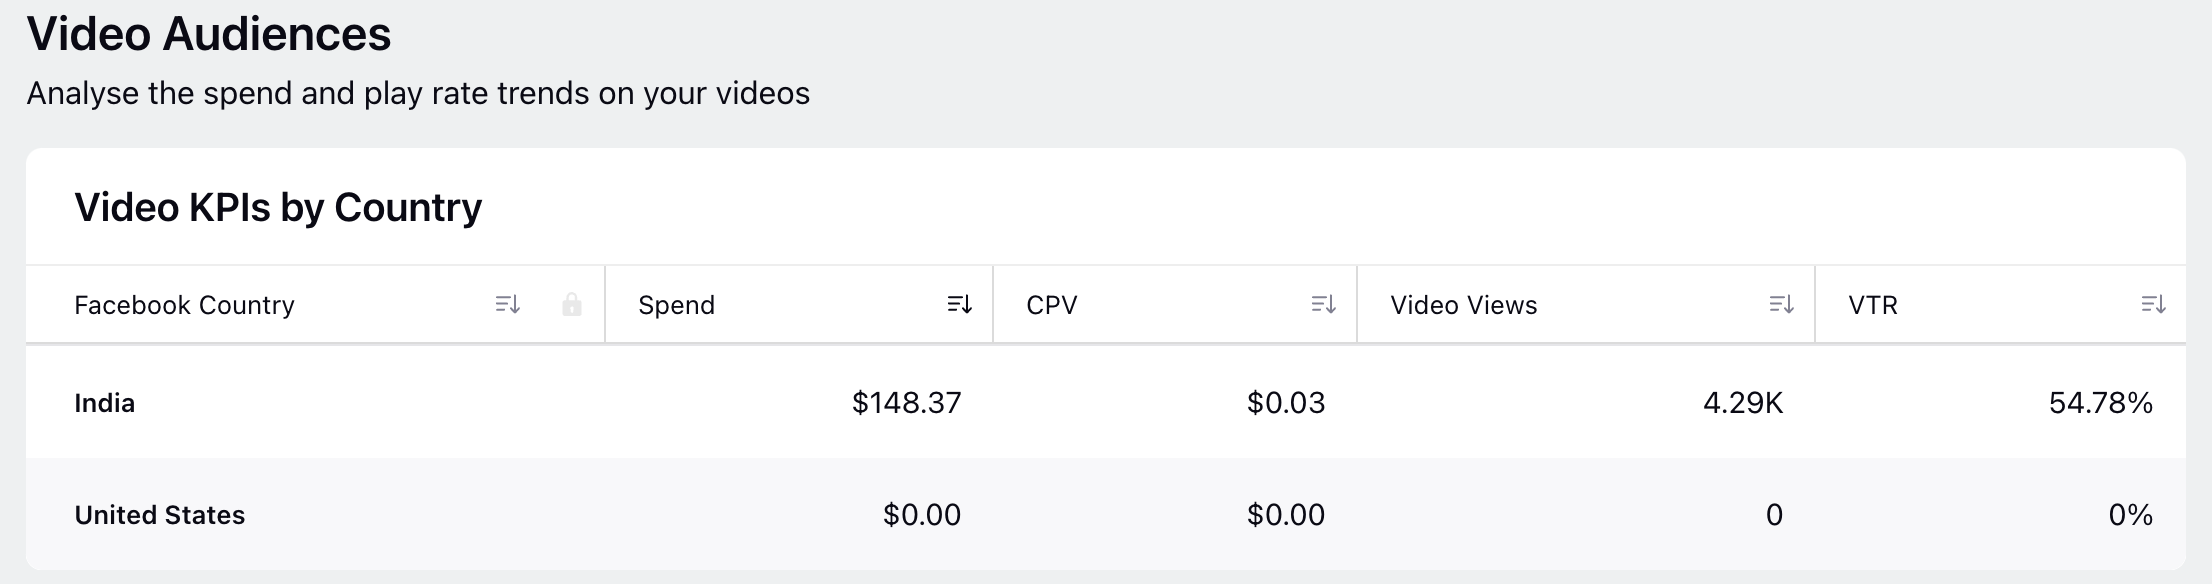
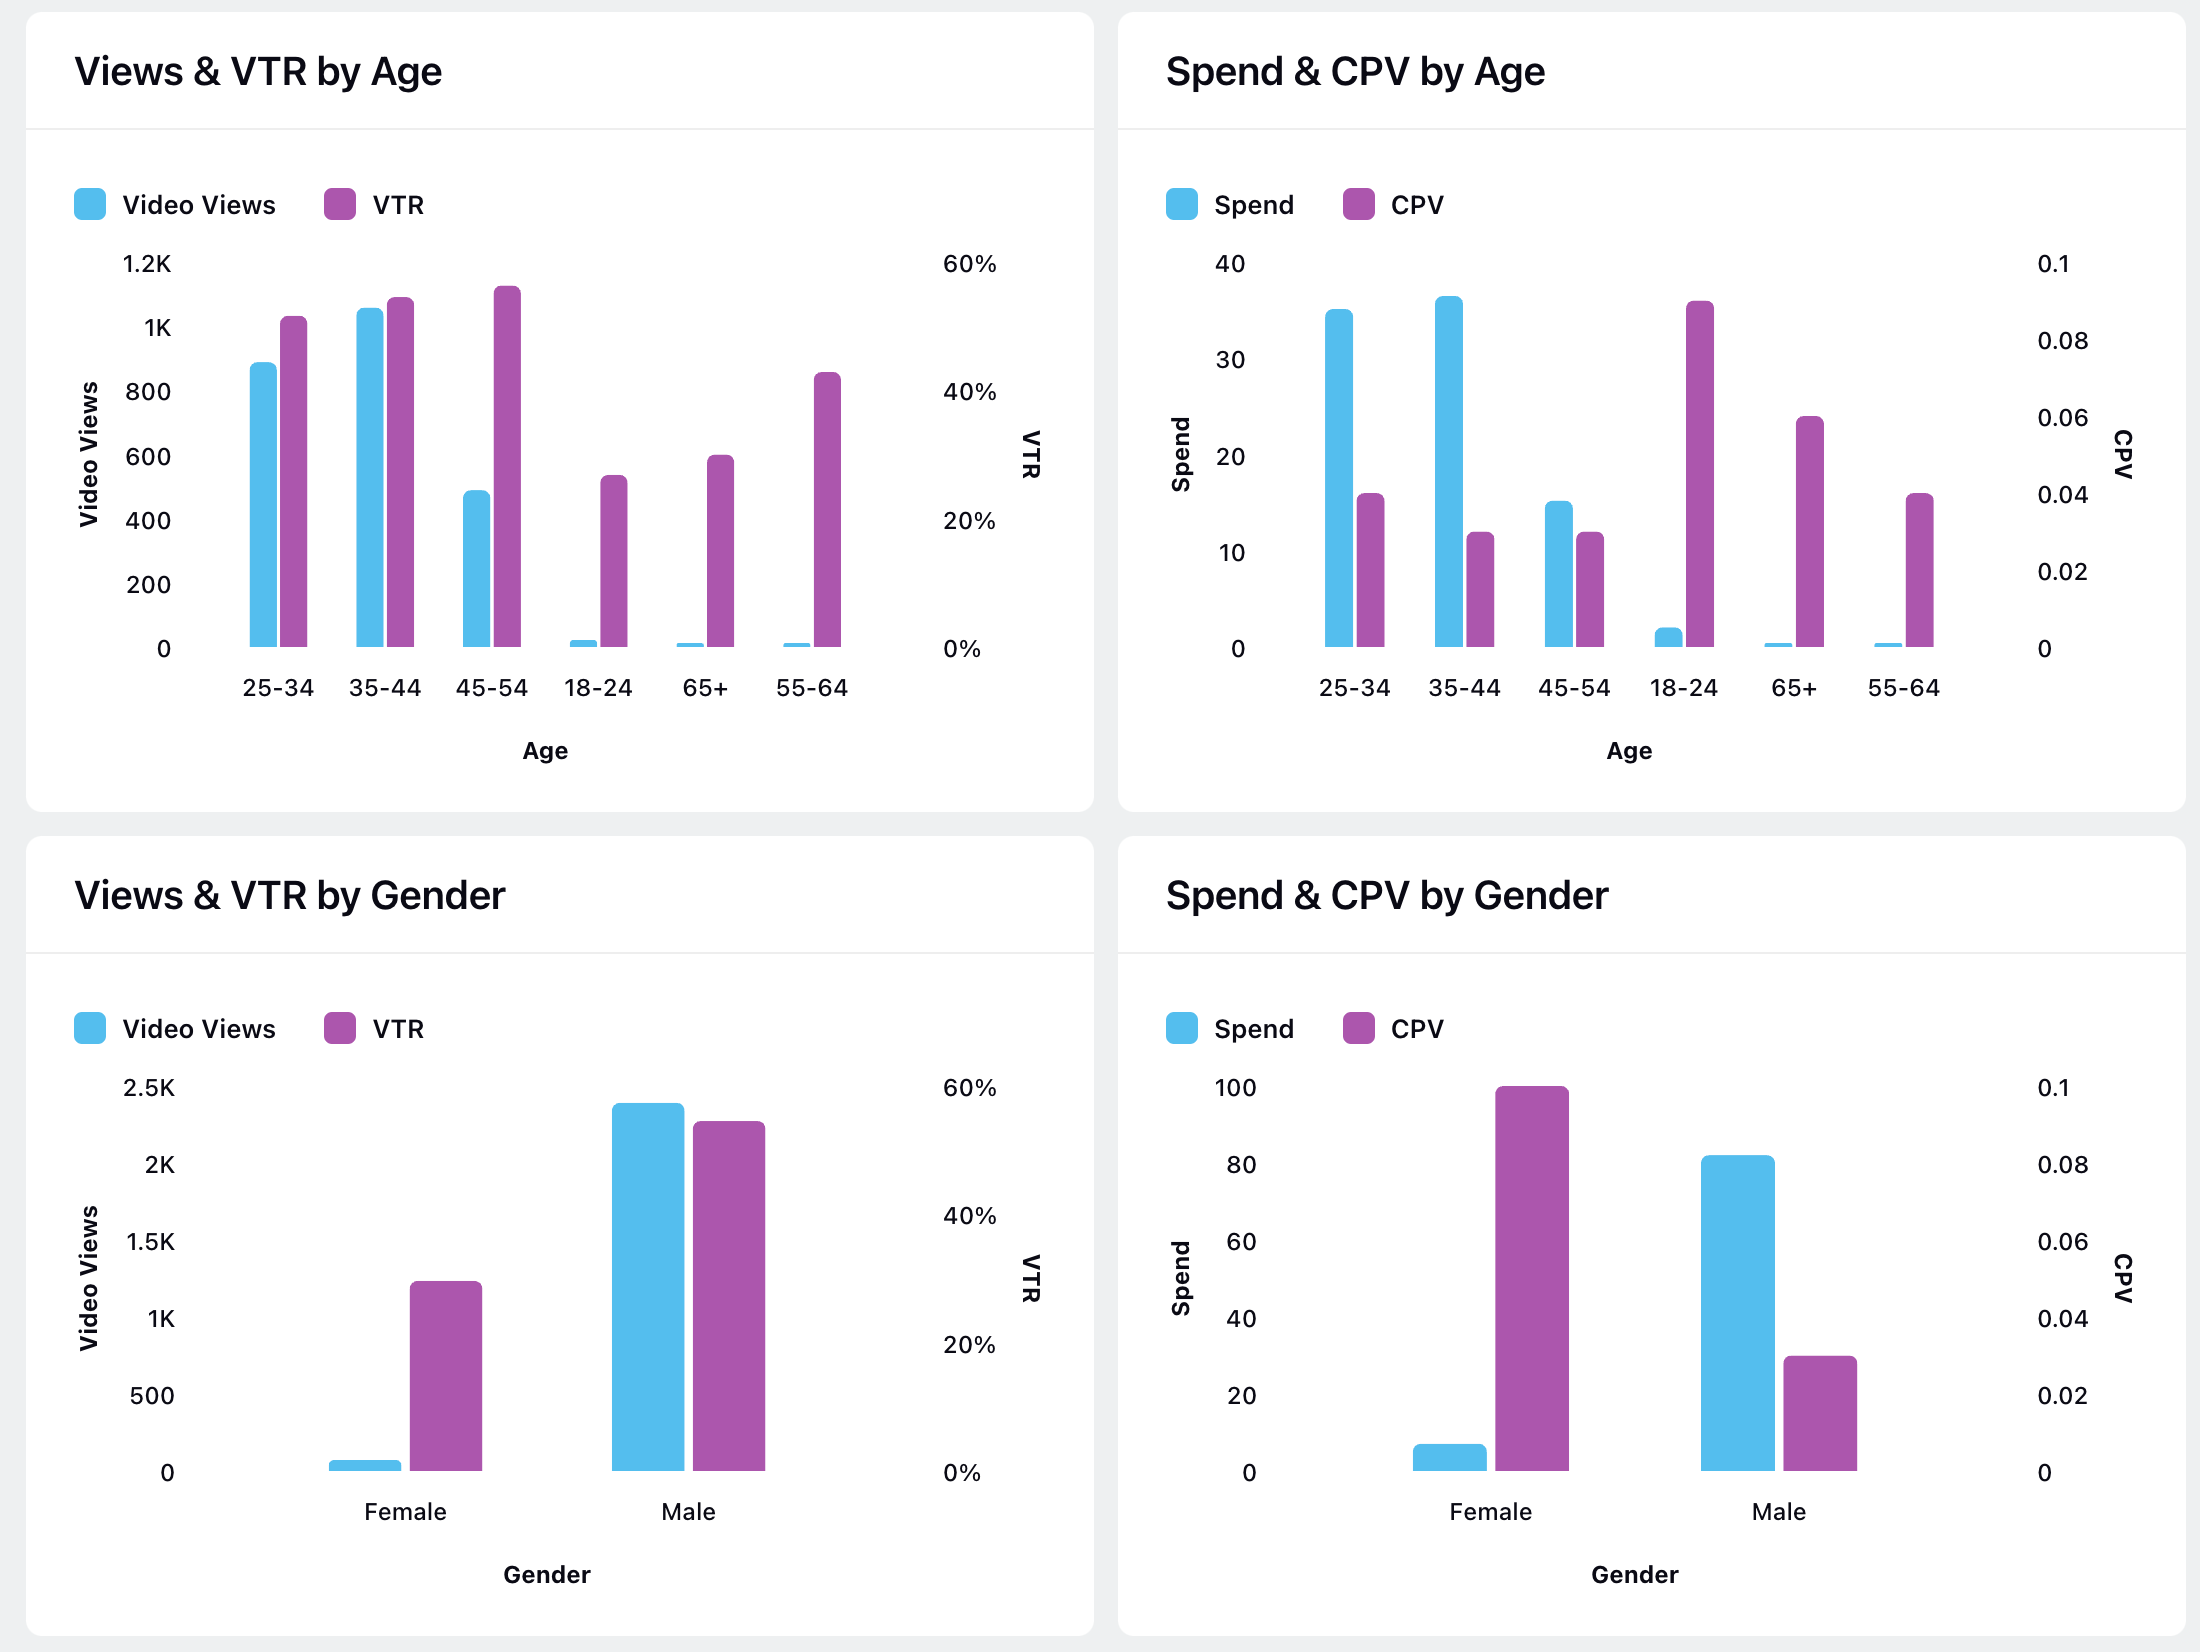
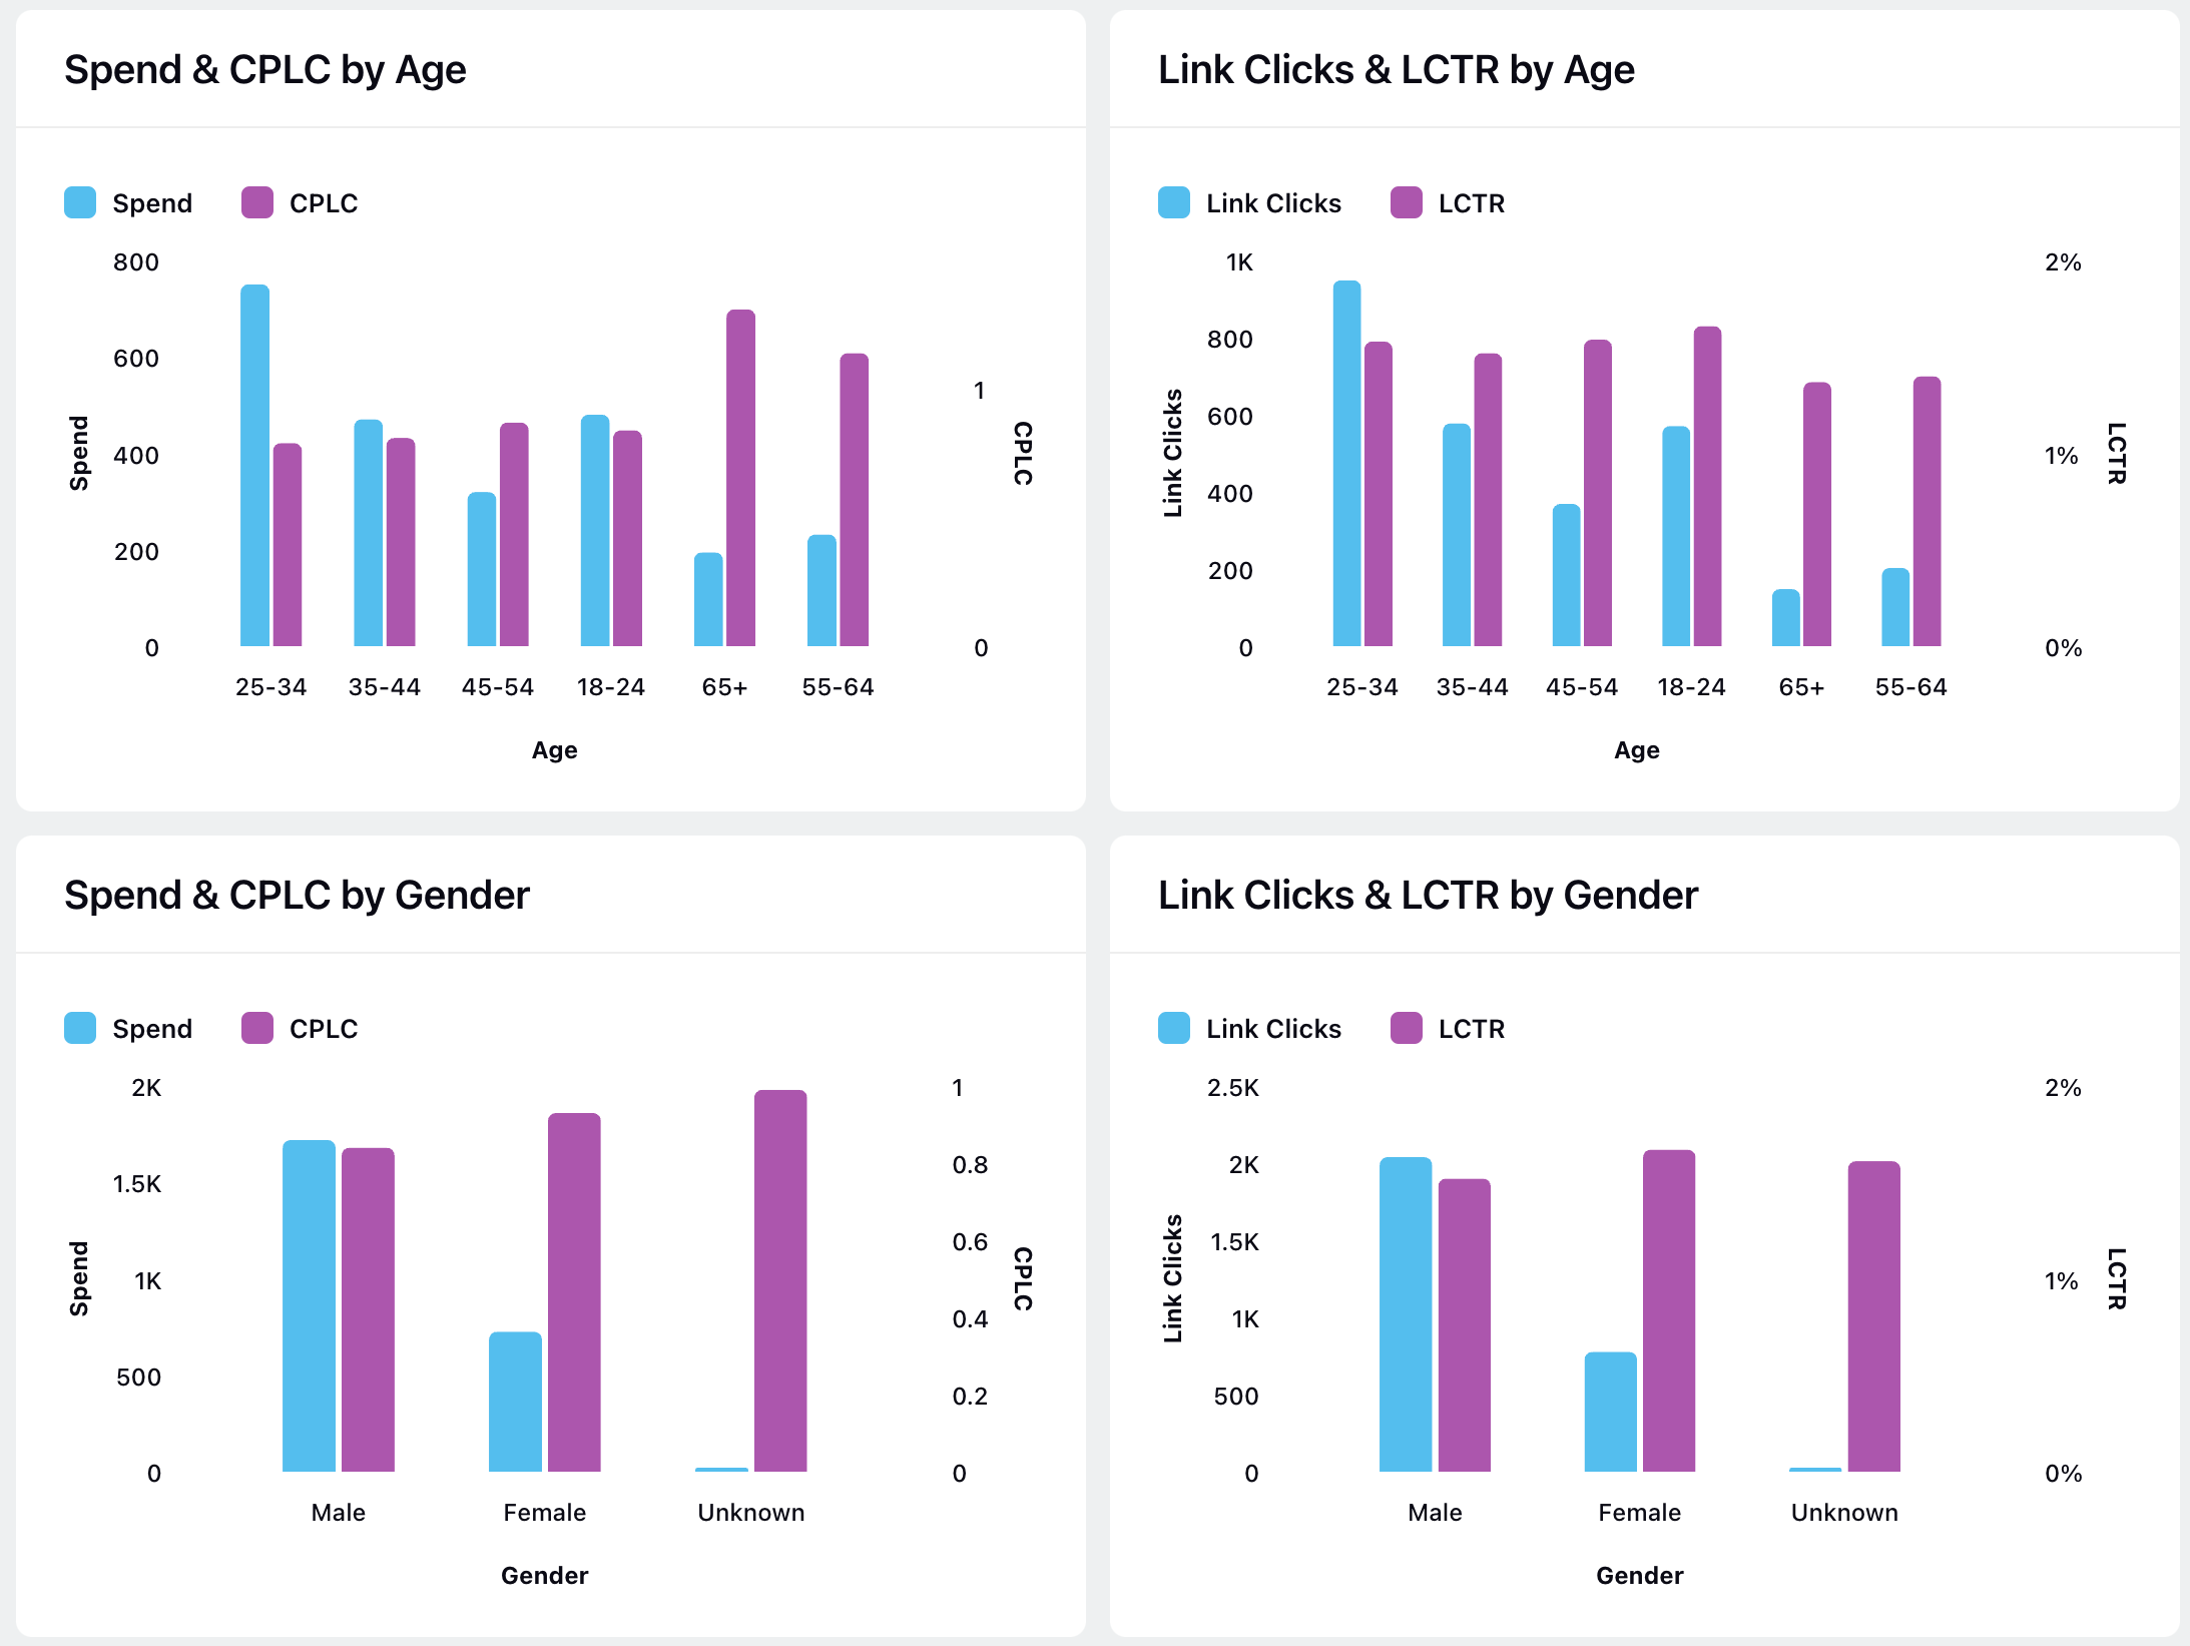
Audience Tab:
Video Audiences:
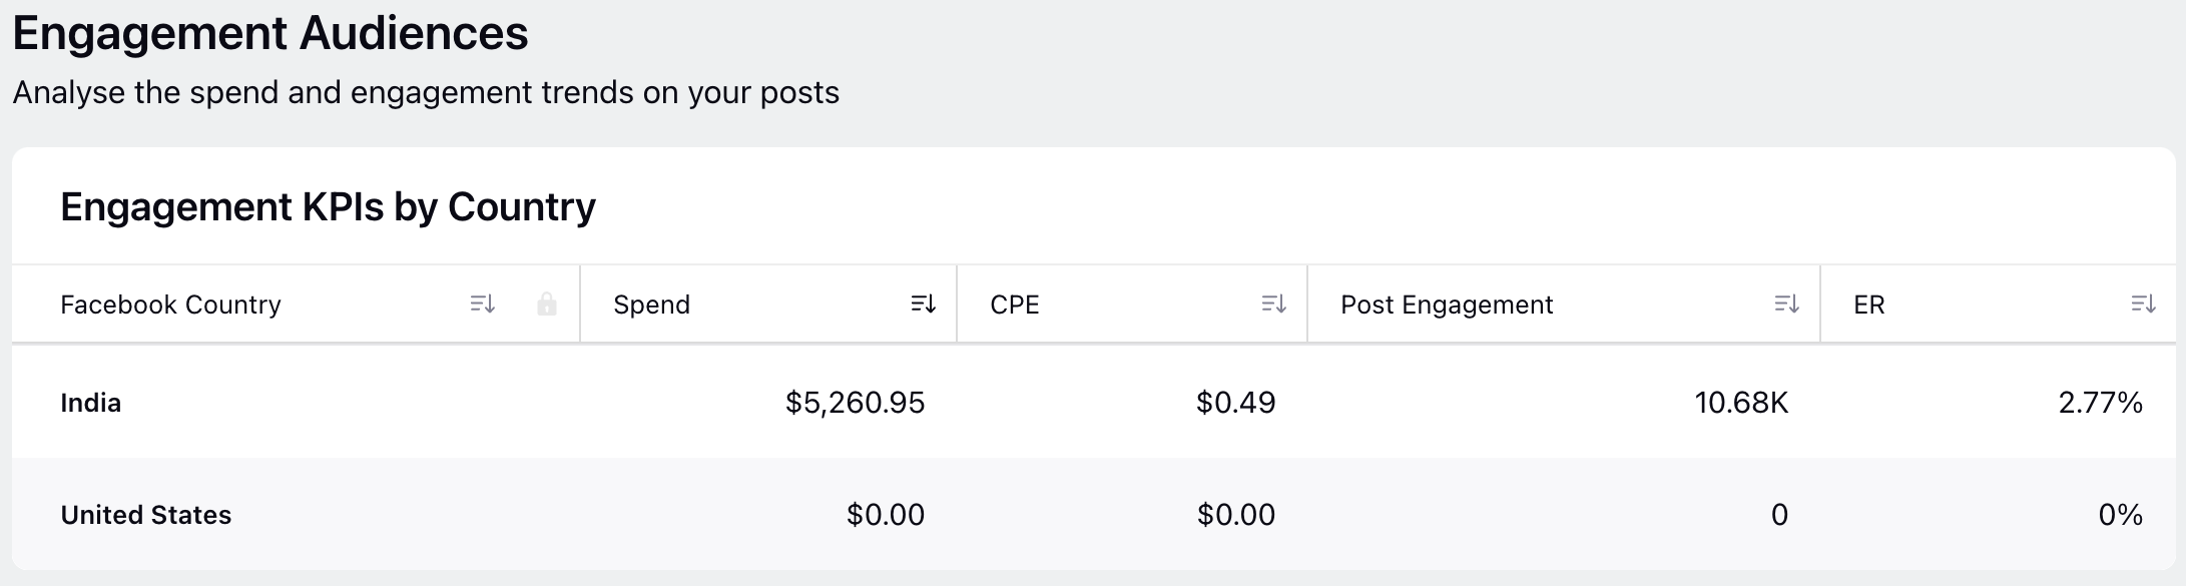
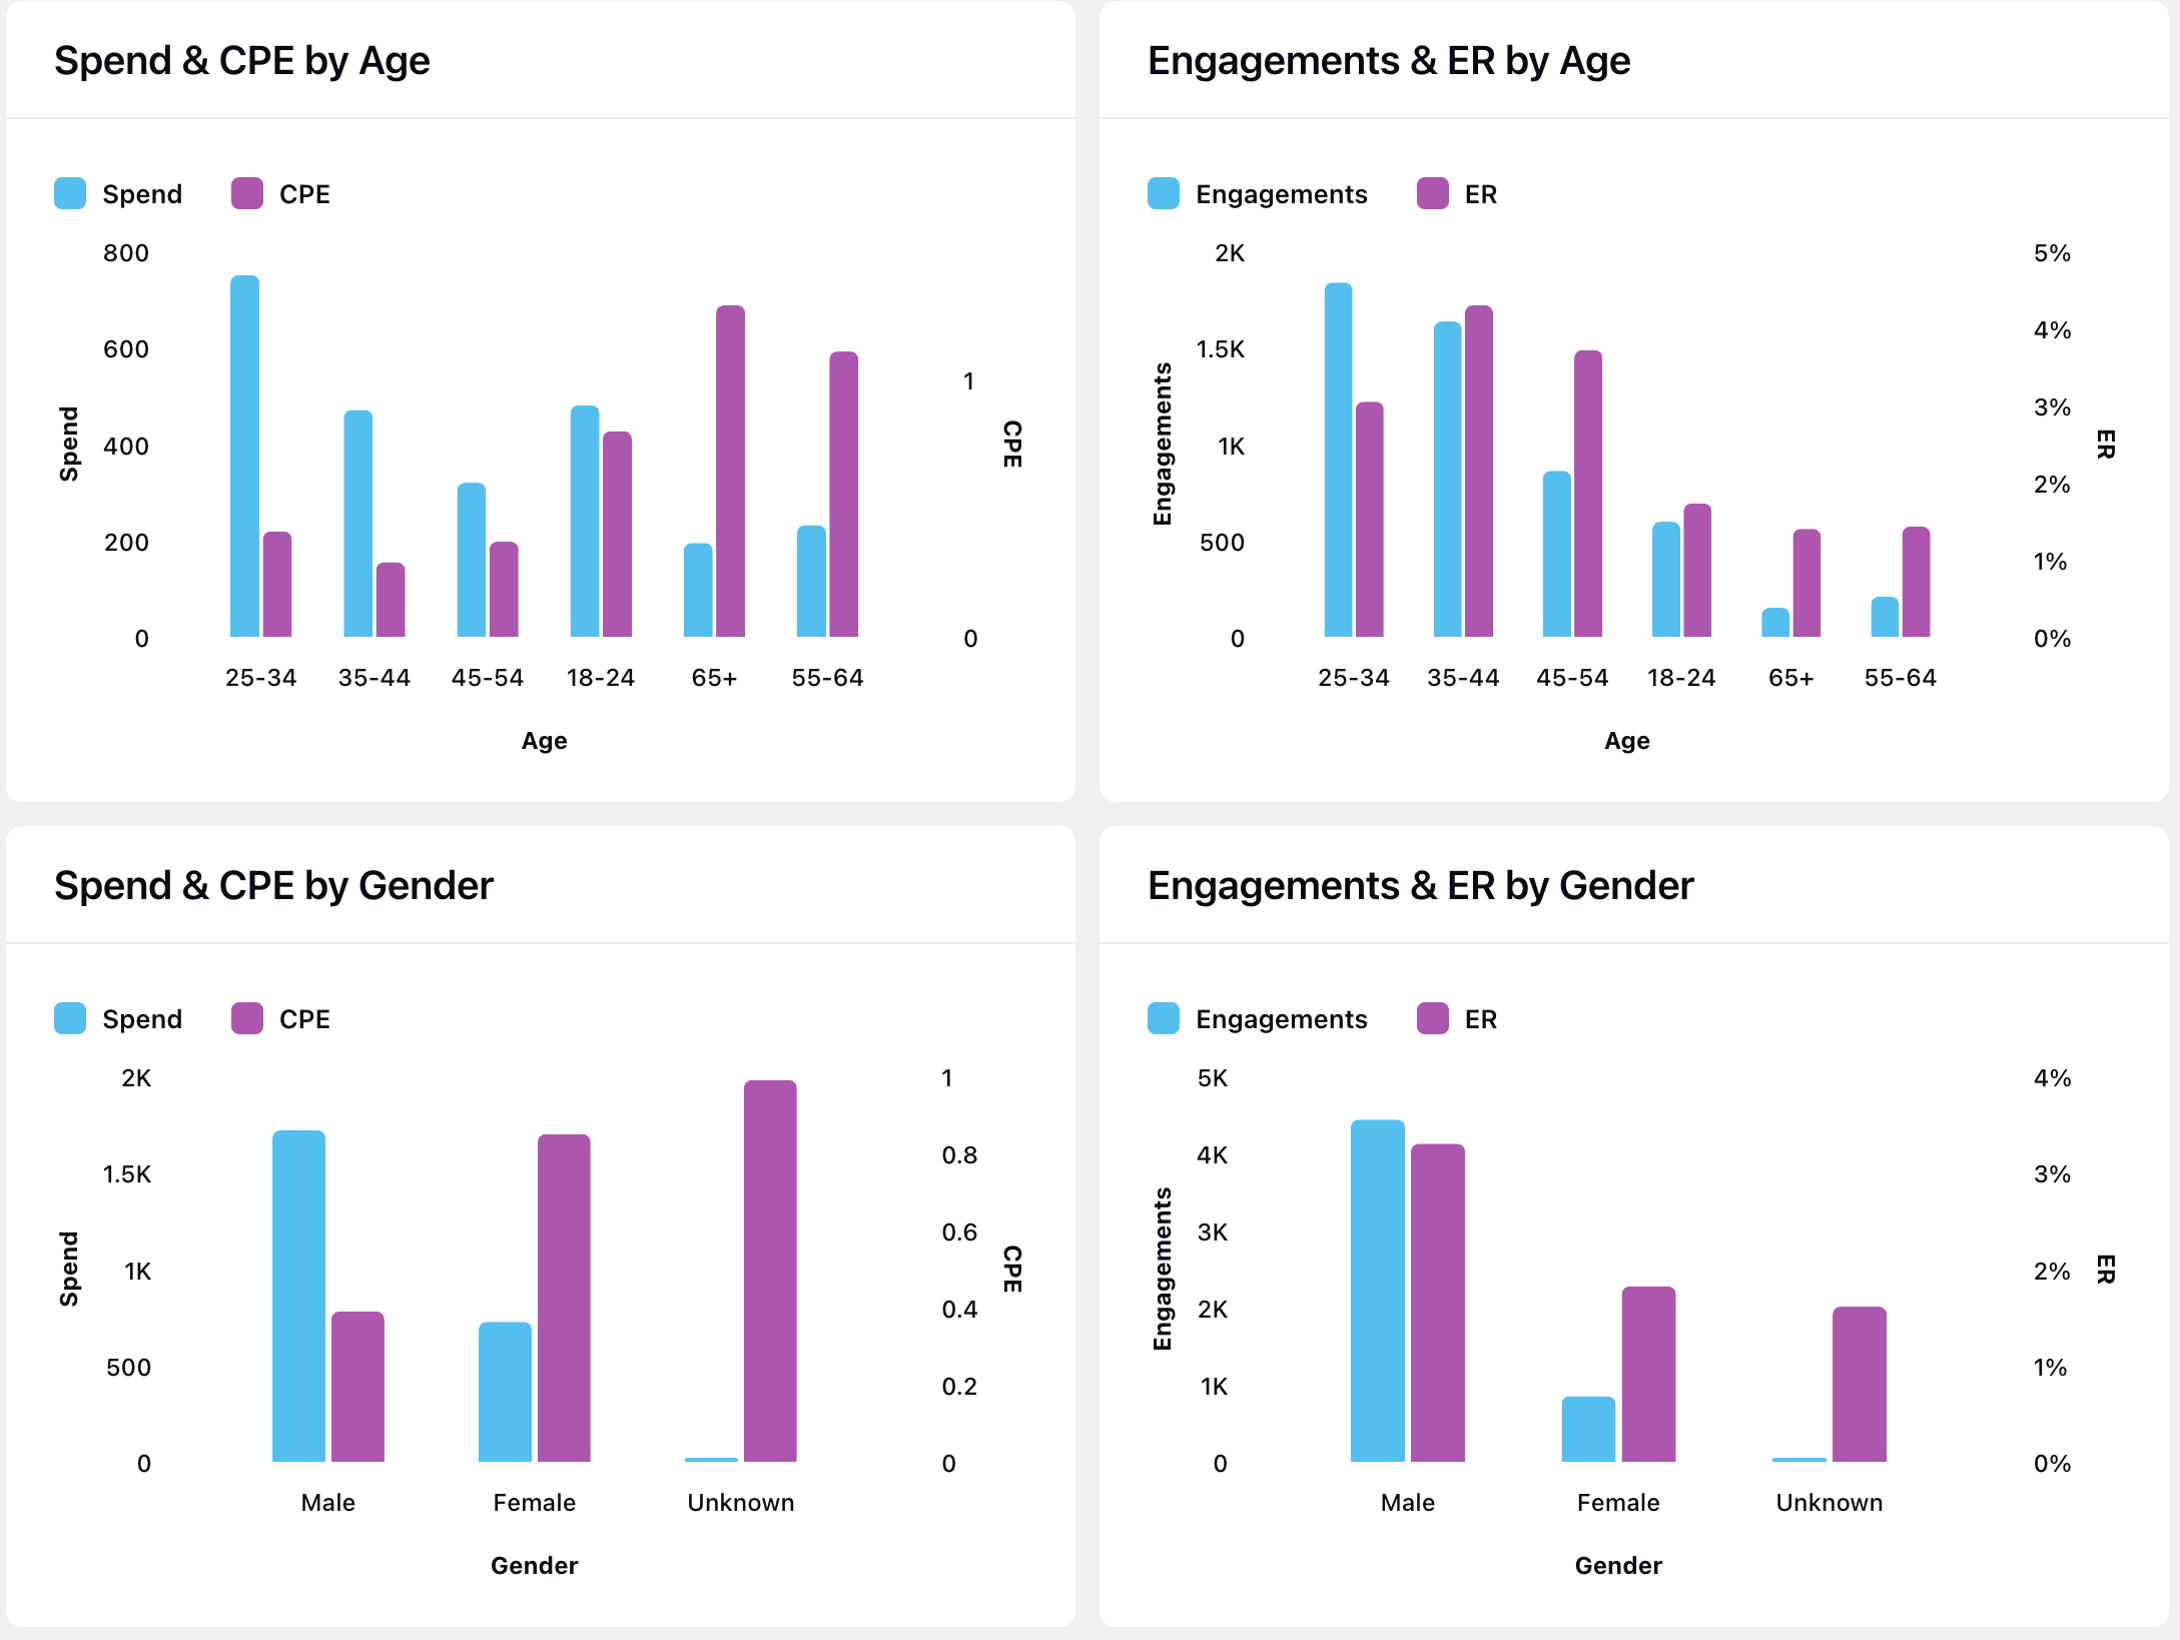
Engagement Audiences:
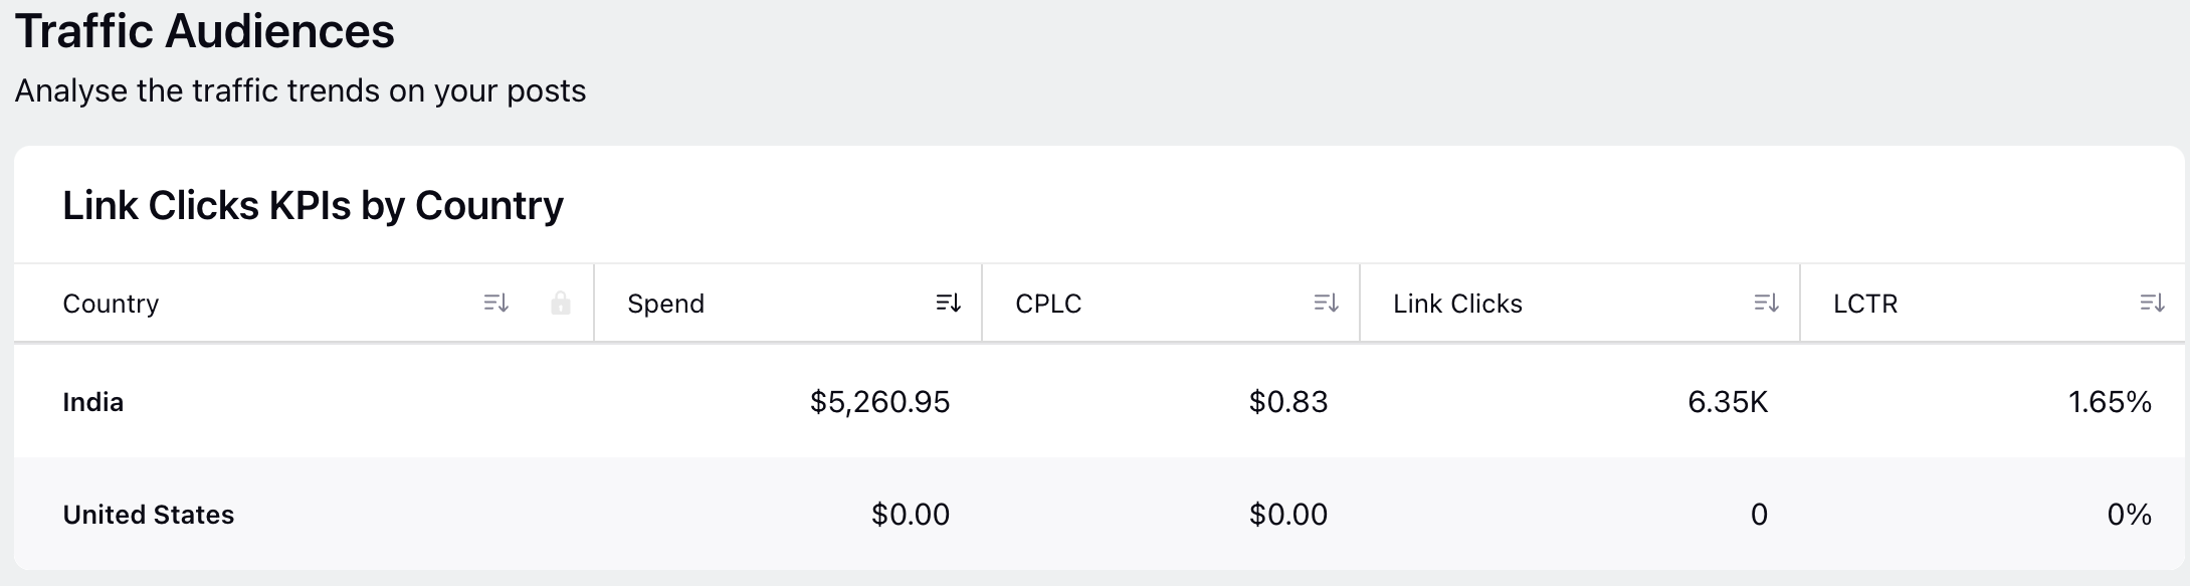
Traffic Audiences:
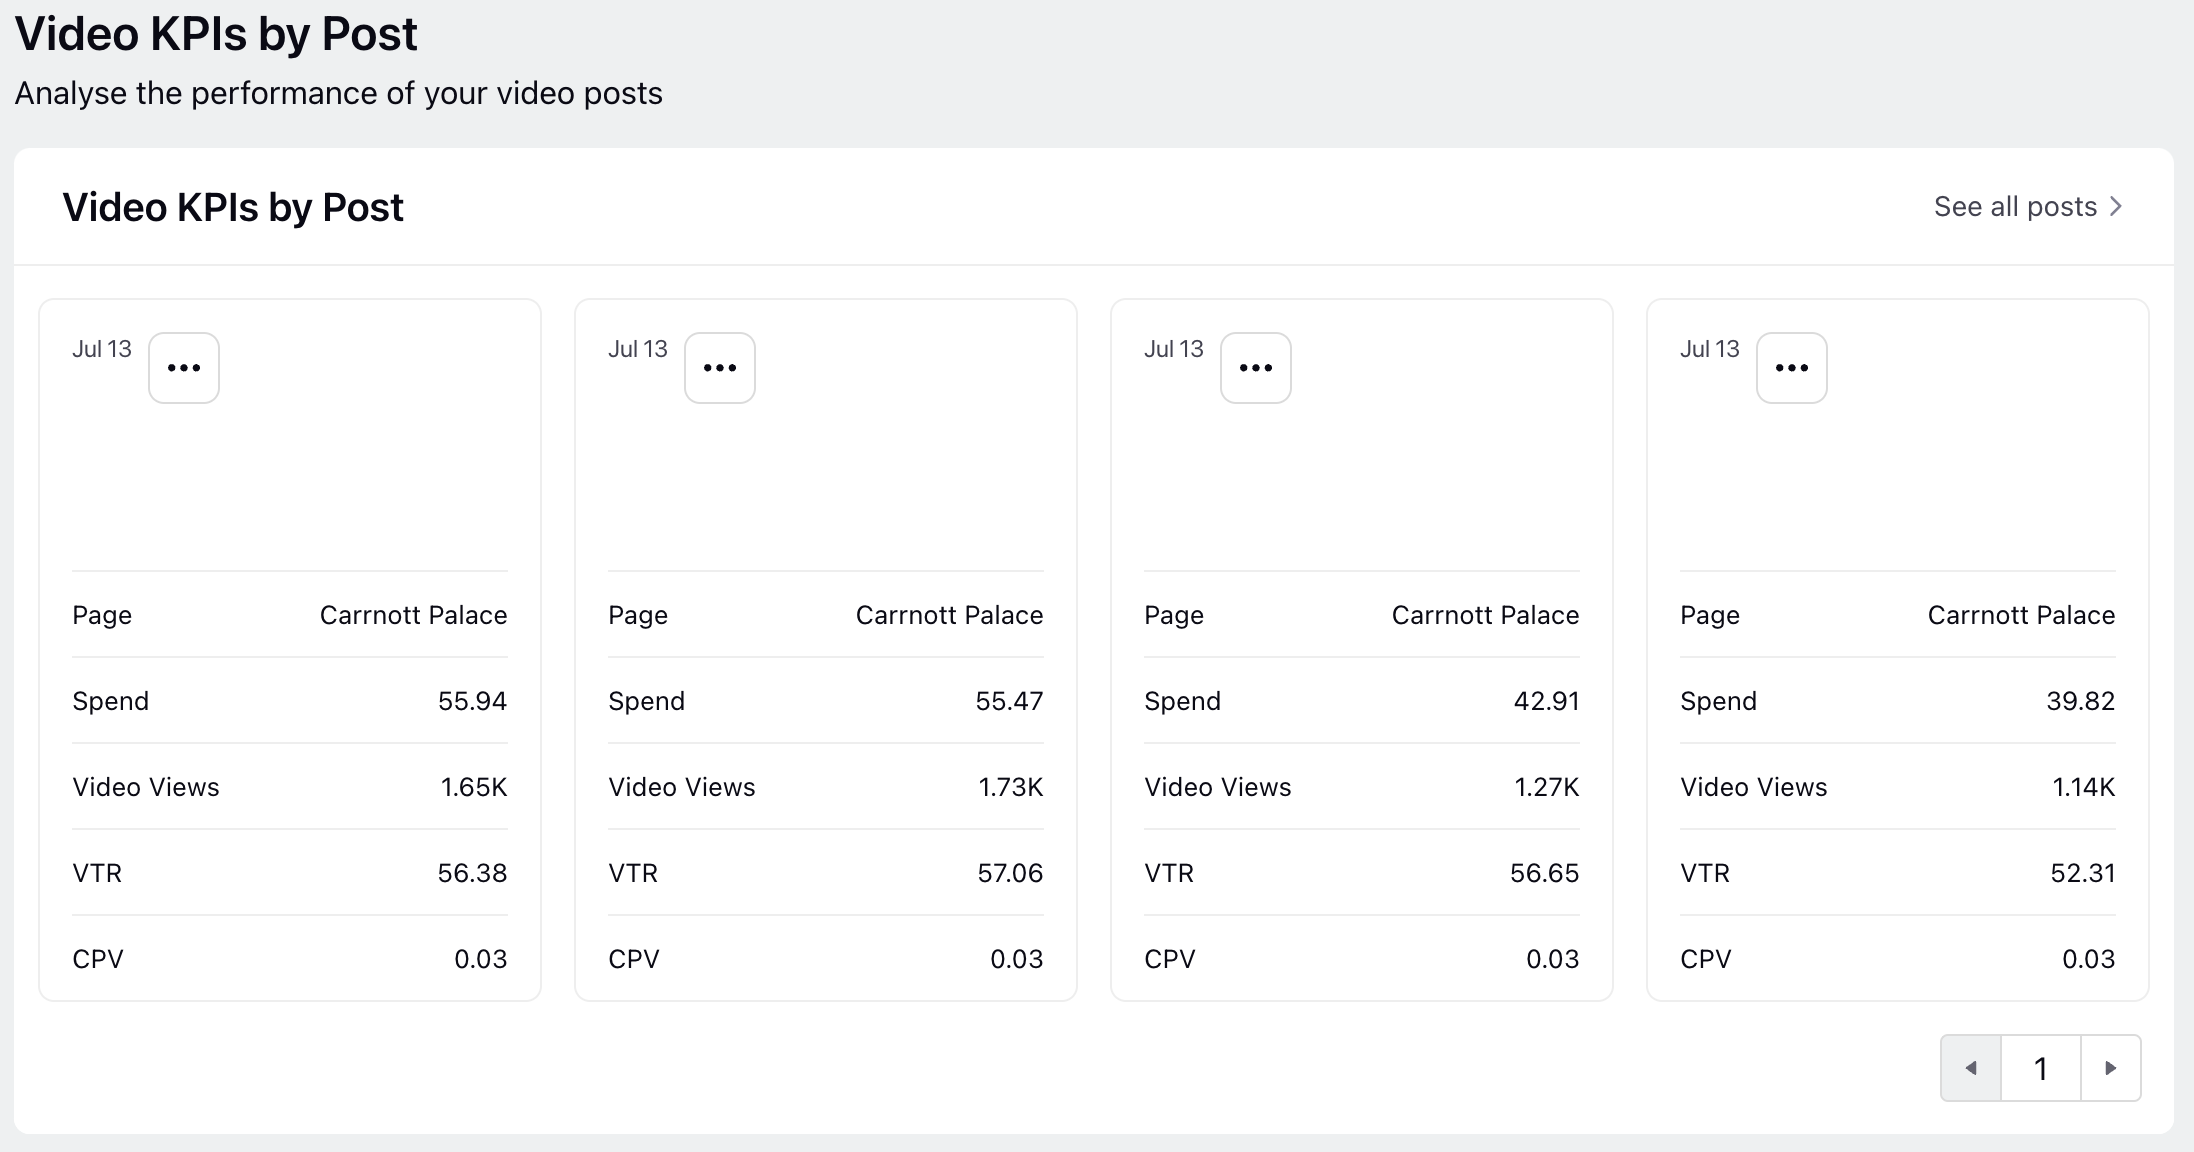
Creatives Tab:
Video KPIs by Post:
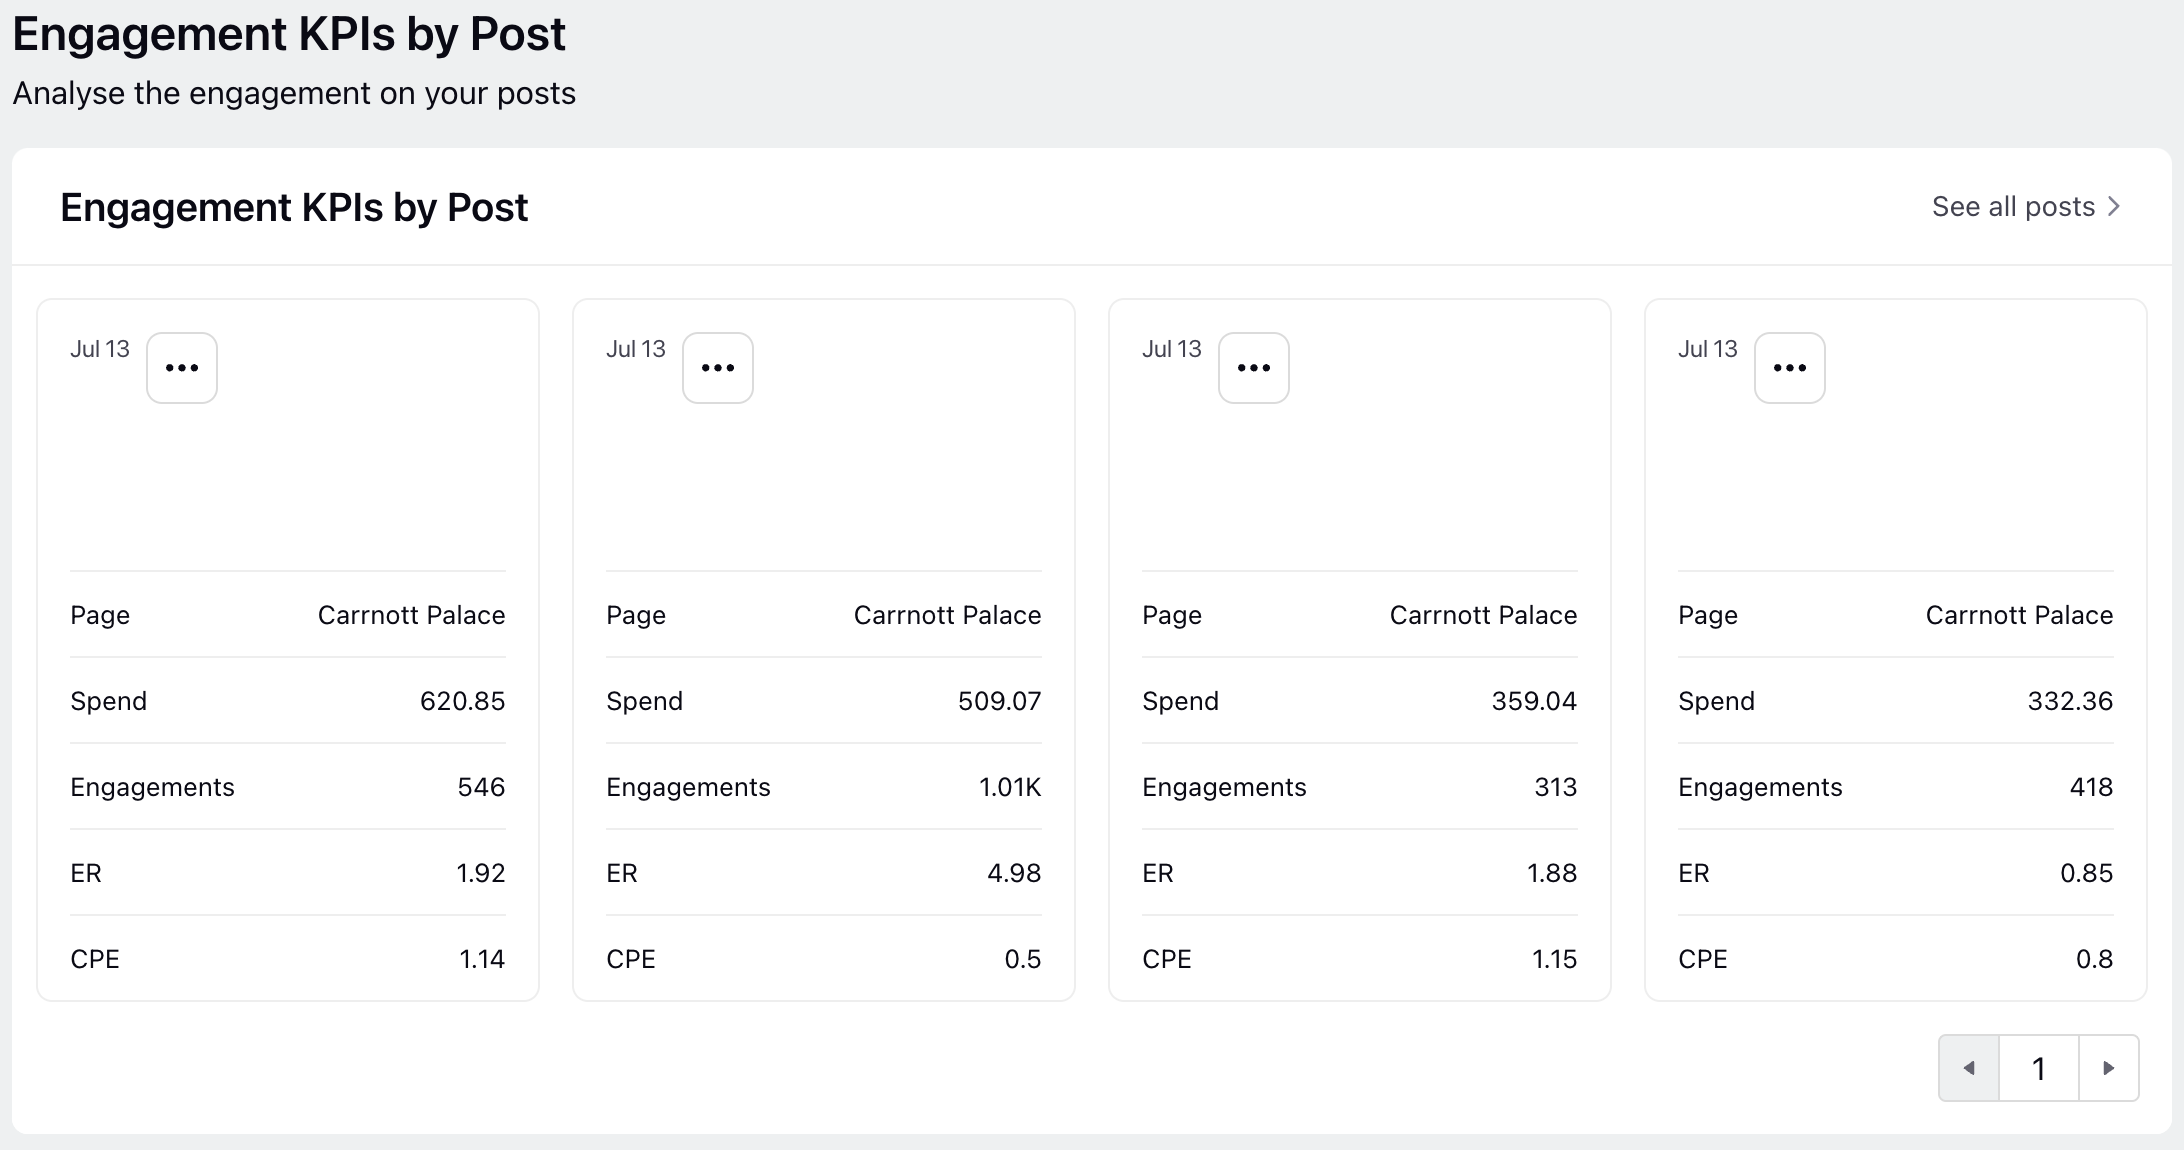
Engagement KPIs by Post:
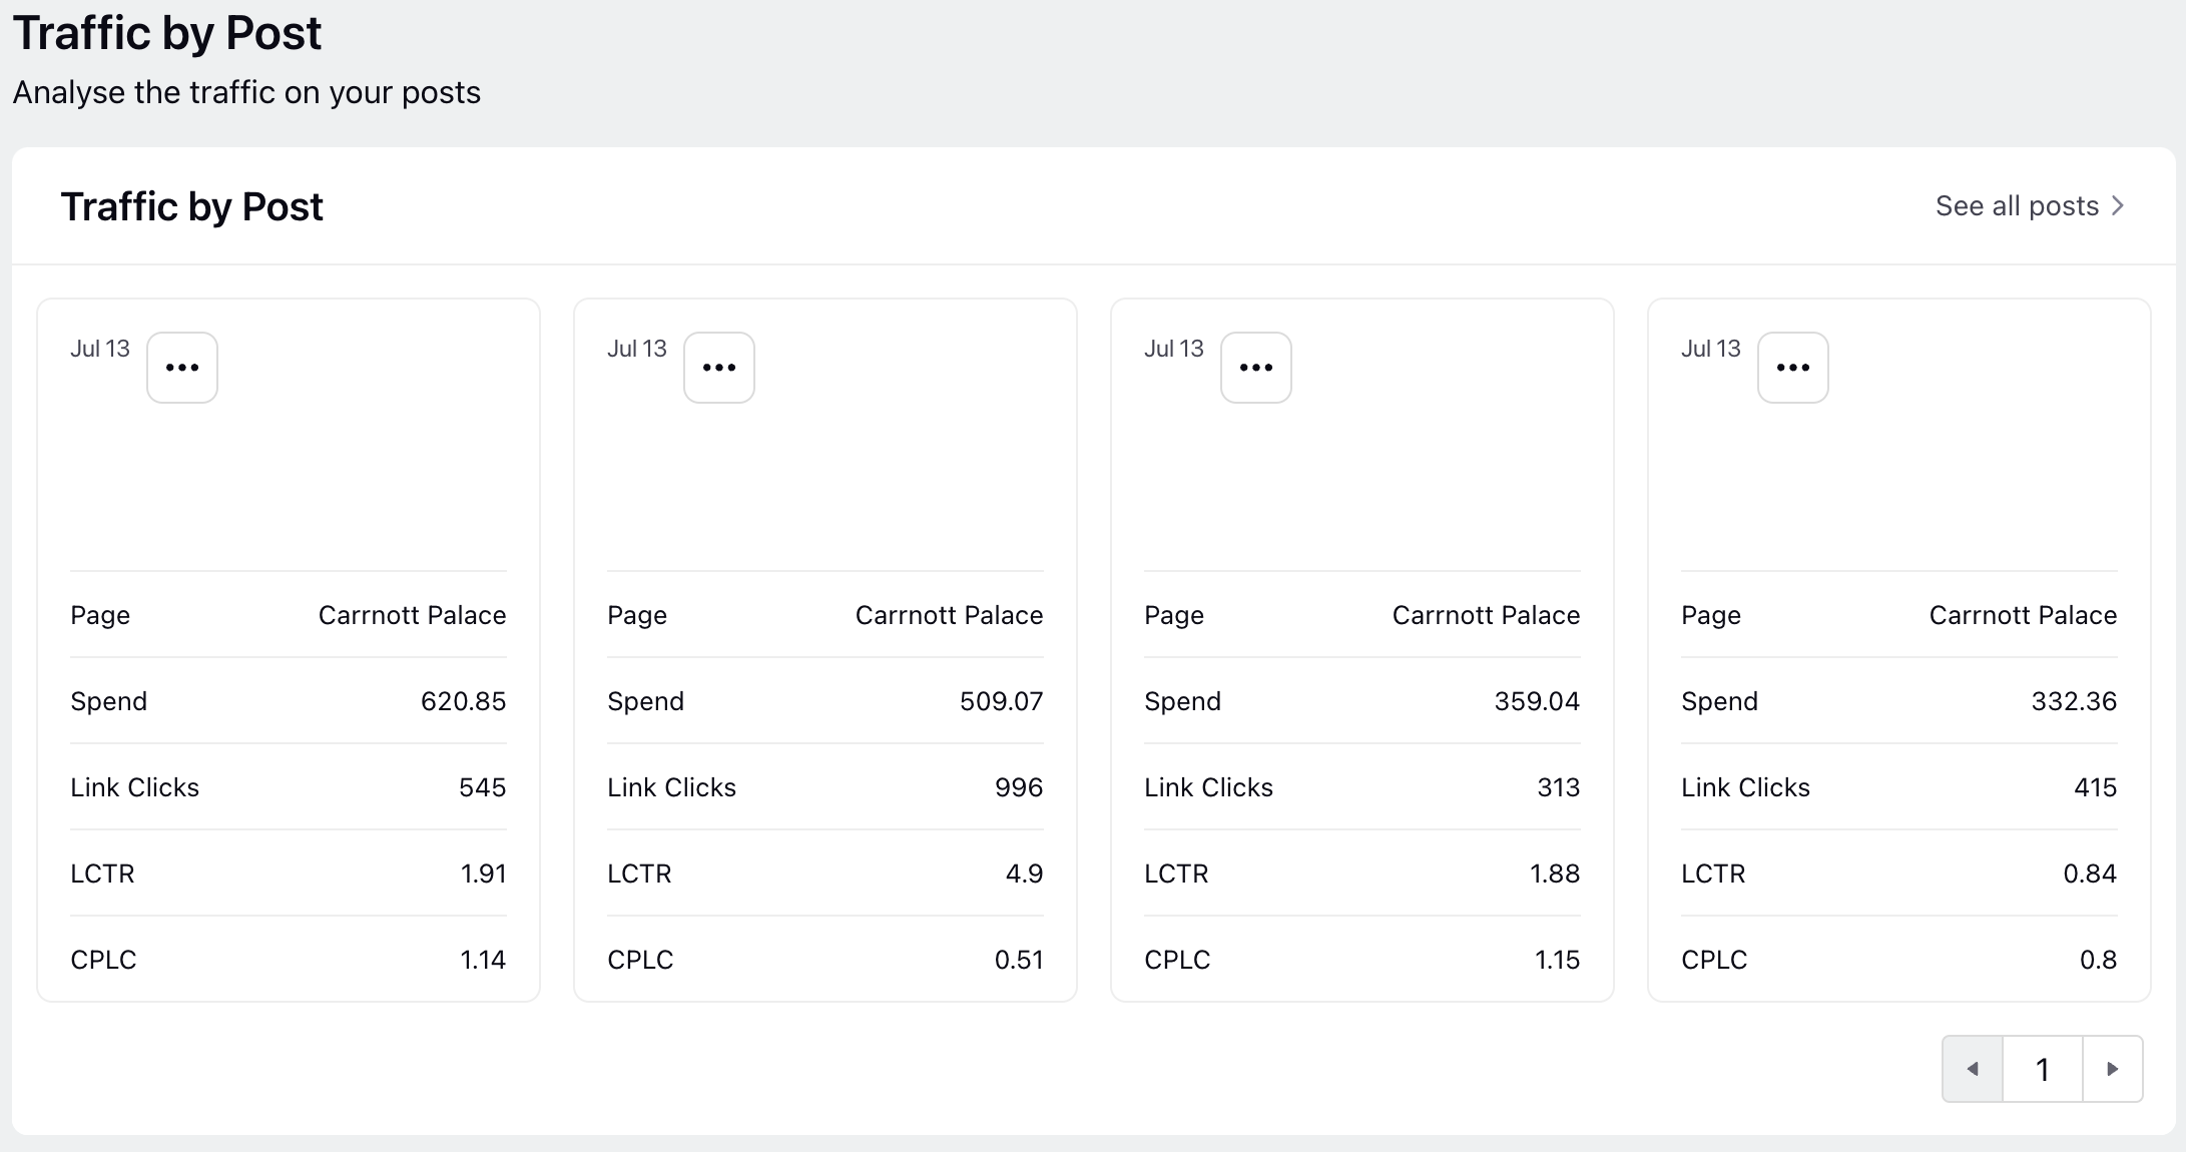
Traffic by Post: