Create Custom Reports in Sprinklr Self-Serve
Updated
With Sprinklr Self-Serve, businesses can now create custom reports tailored to their specific needs. This ensures that social media analysis aligns directly with business objectives, leading to more effective strategies and improved performance.
Why Create Custom Reports in Sprinklr Self-Serve?
Business-Specific Insights: Tailor reports to match your unique business goals and KPIs, ensuring the data is directly relevant to your strategies.
Real-Time Data: Access up-to-date data for timely decision-making and swift responses to changes in your social media landscape.
Performance Tracking: Monitor campaign effectiveness and content performance to identify successful initiatives and areas needing improvement.
Stakeholder Reporting: Generate reports suited to the needs of various stakeholders, ensuring clarity and relevance for all audiences.
Step-by-Step Guide to create Custom Reports
Click on the Reporting icon located on the left-hand side of Sprinklr Self-Serve.
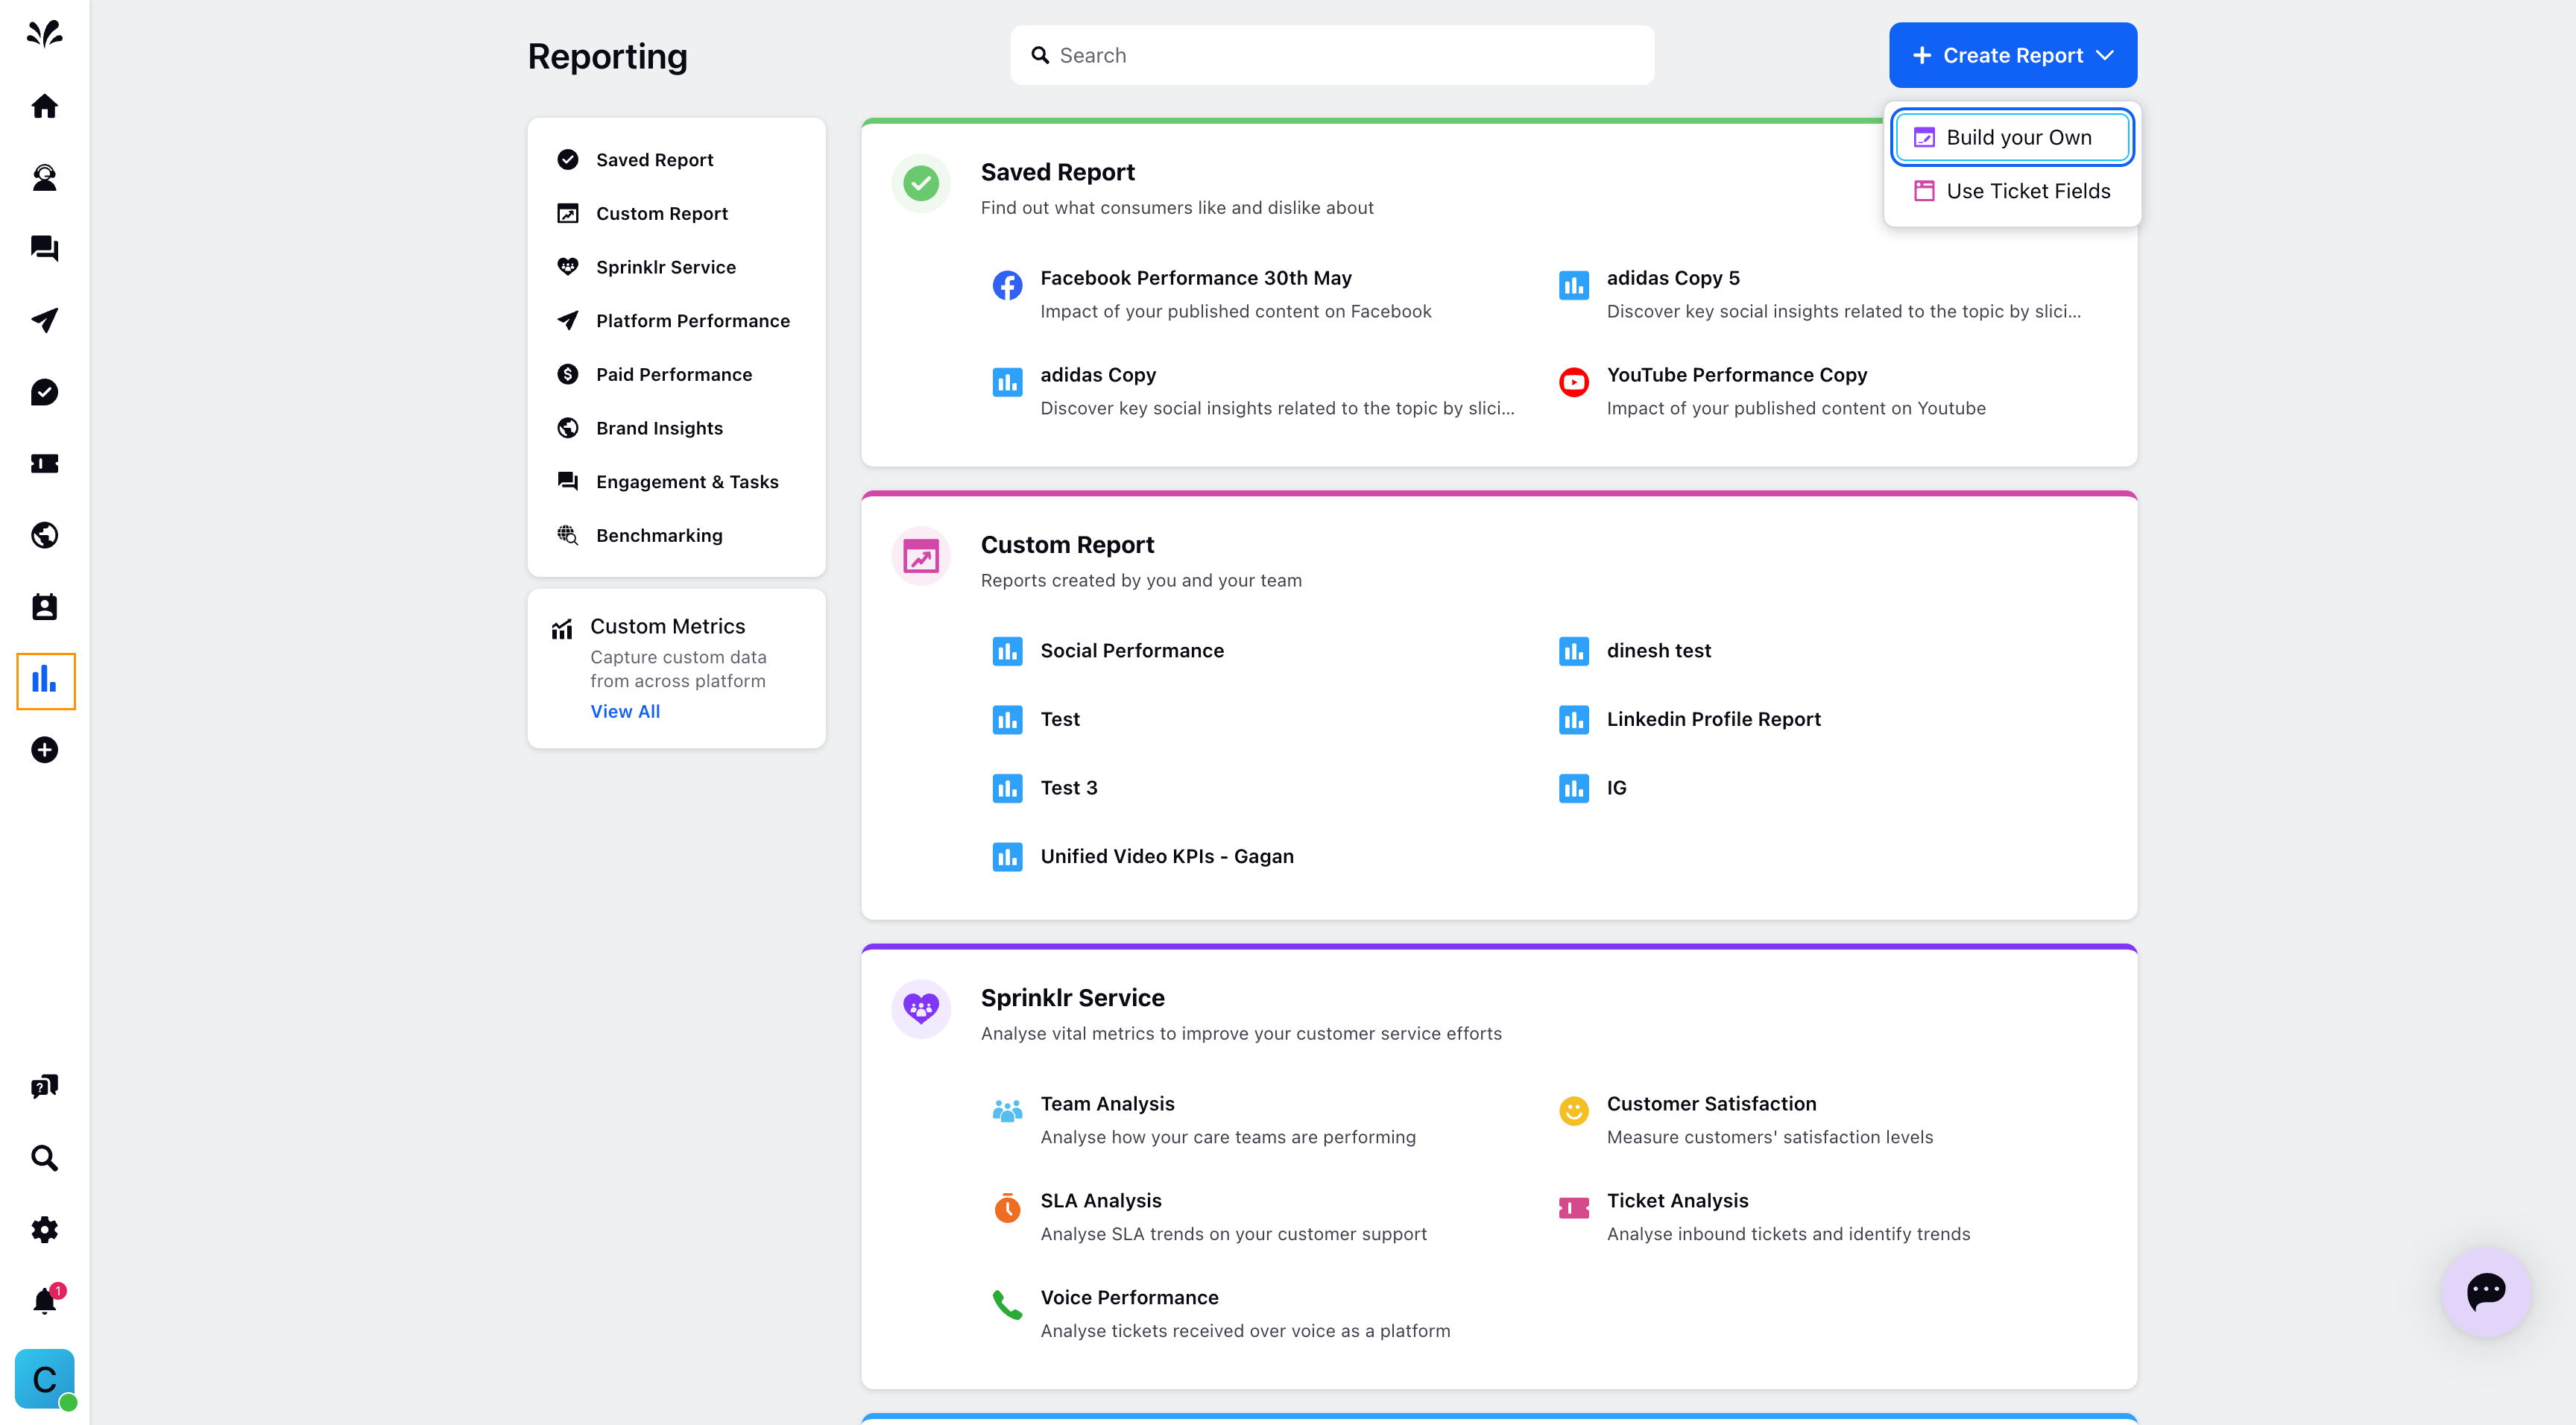
Click on the Create Report icon in the top right corner.
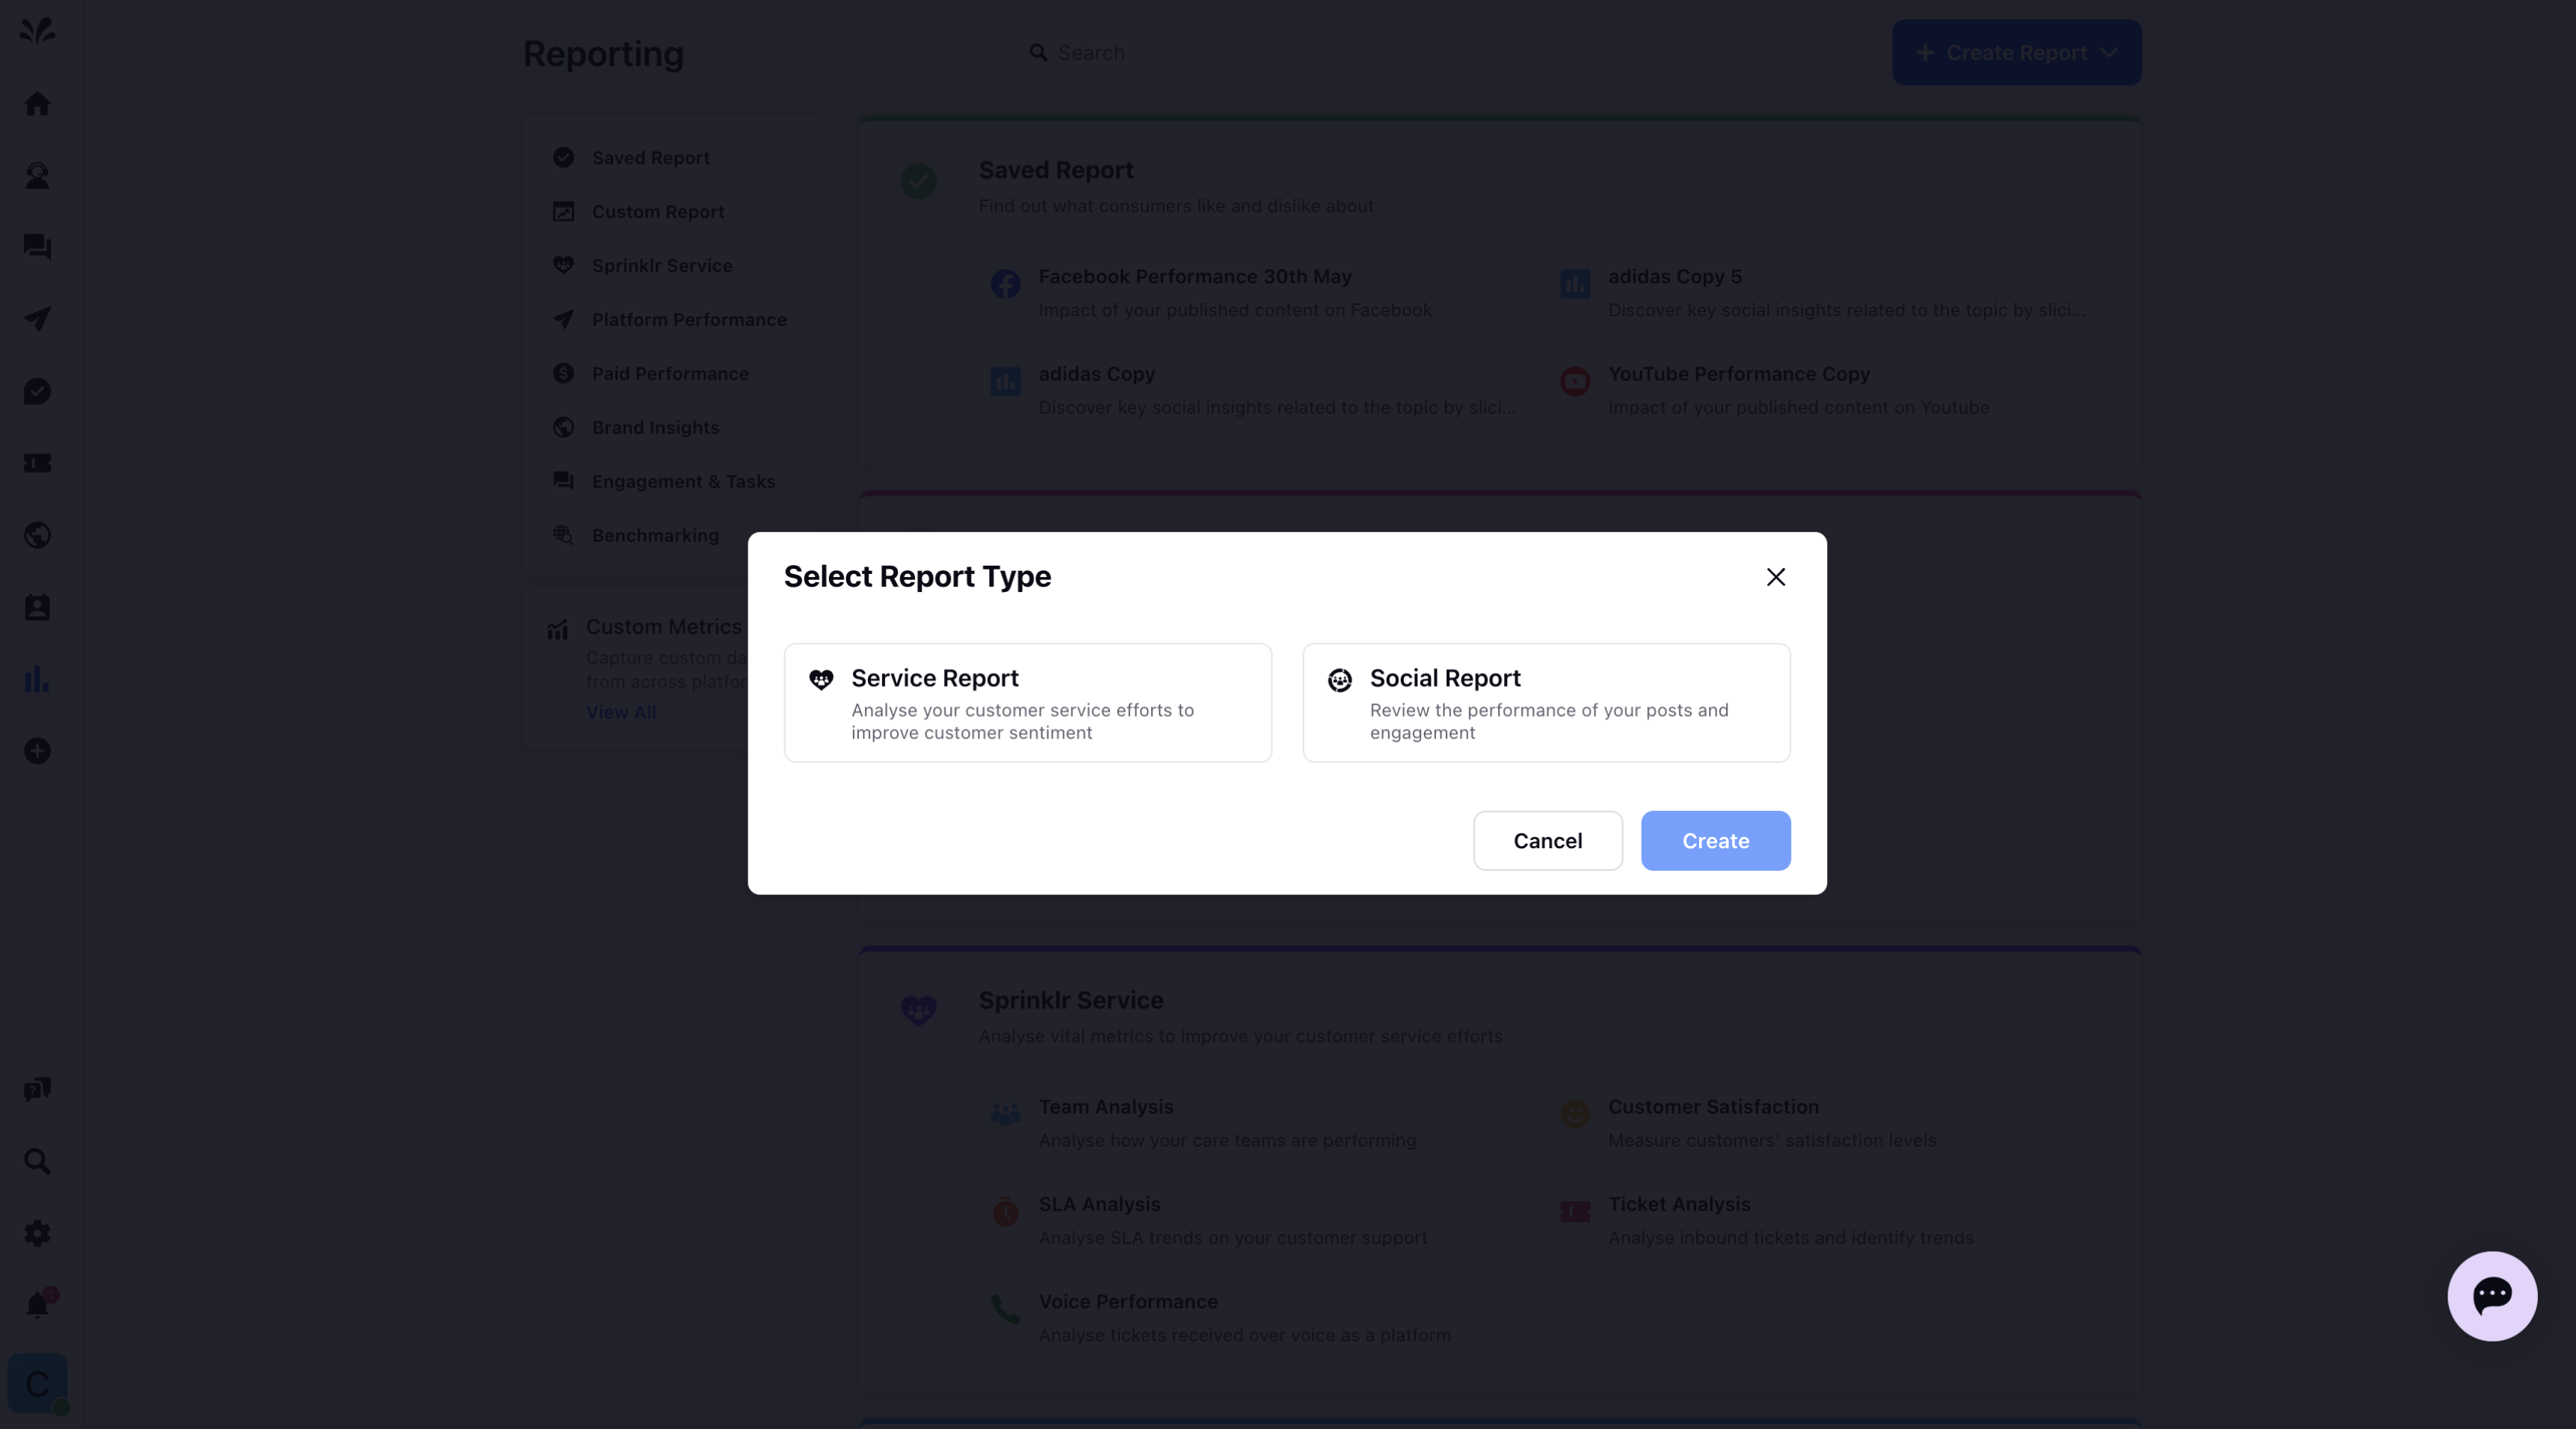
The Report Type dialog box will appear, allowing you to select either a Service Report or a Social Report.
Please note this dialog box will only appear if the user has access to both Sprinklr Social and Sprinklr Service.
Select the report type and click on Create.
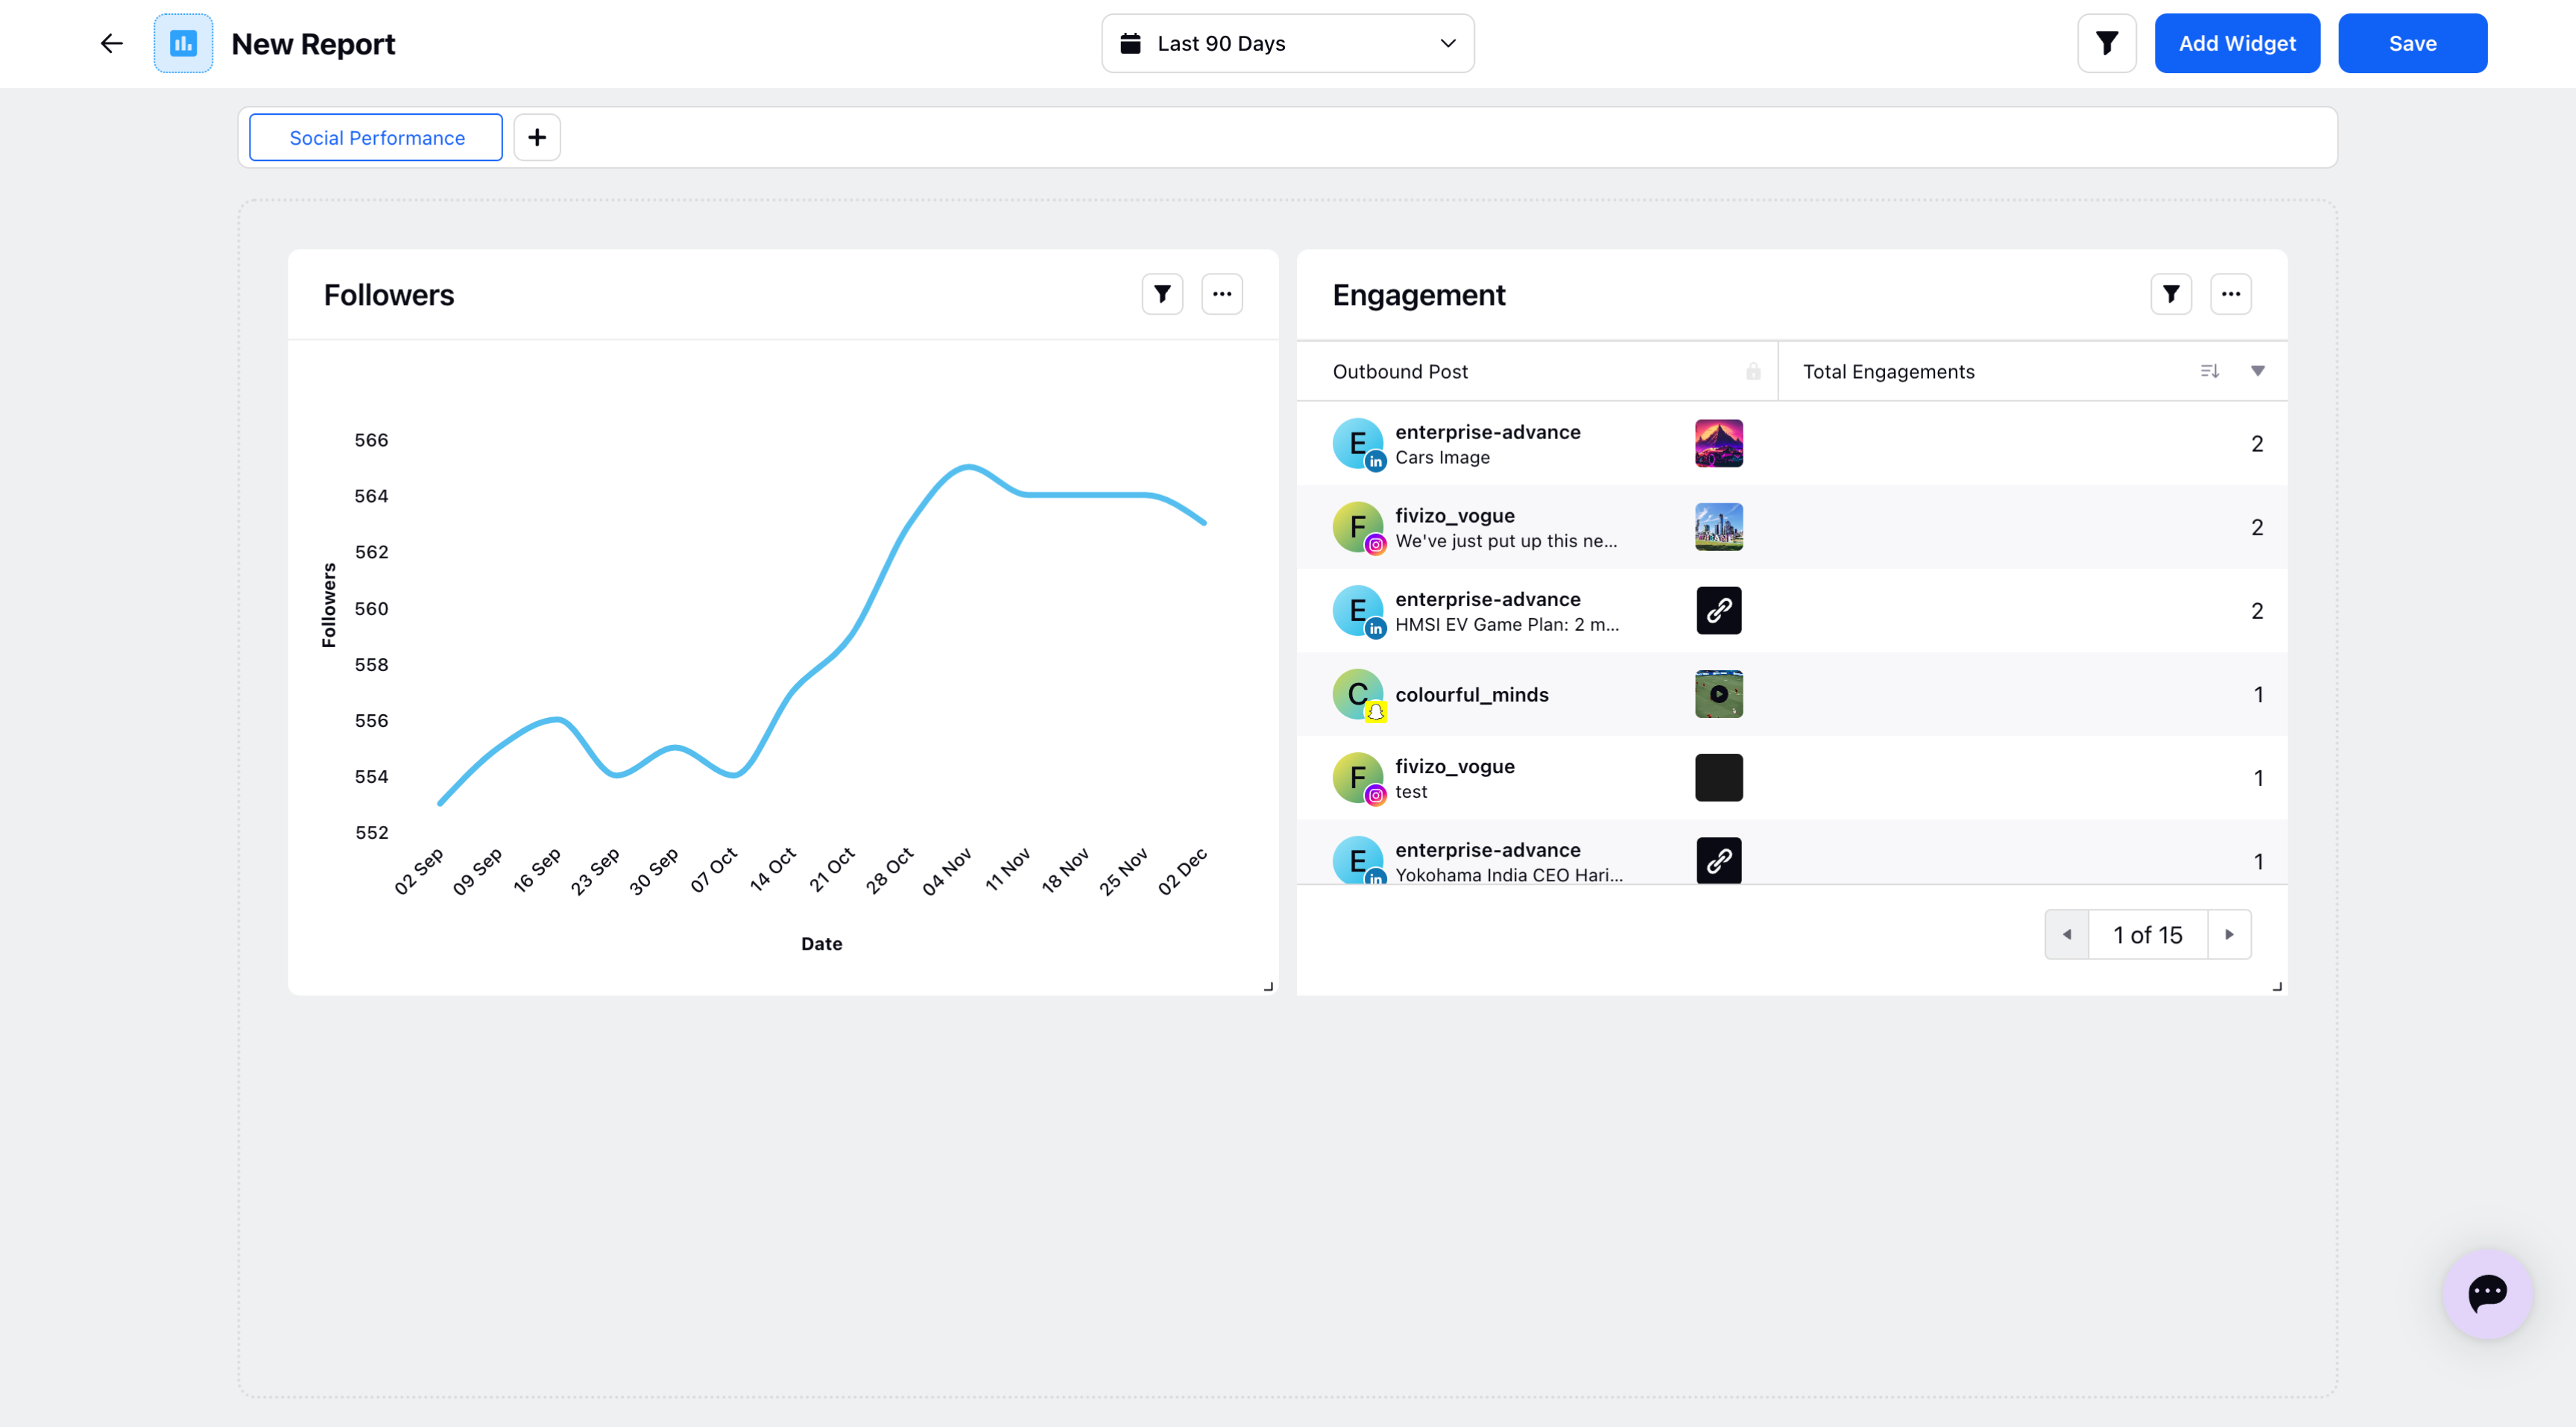
The blank canvas will open. In this canvas, you can add multiple tabs at the top, apply one or multiple filters such as Account, Outbound Post etc
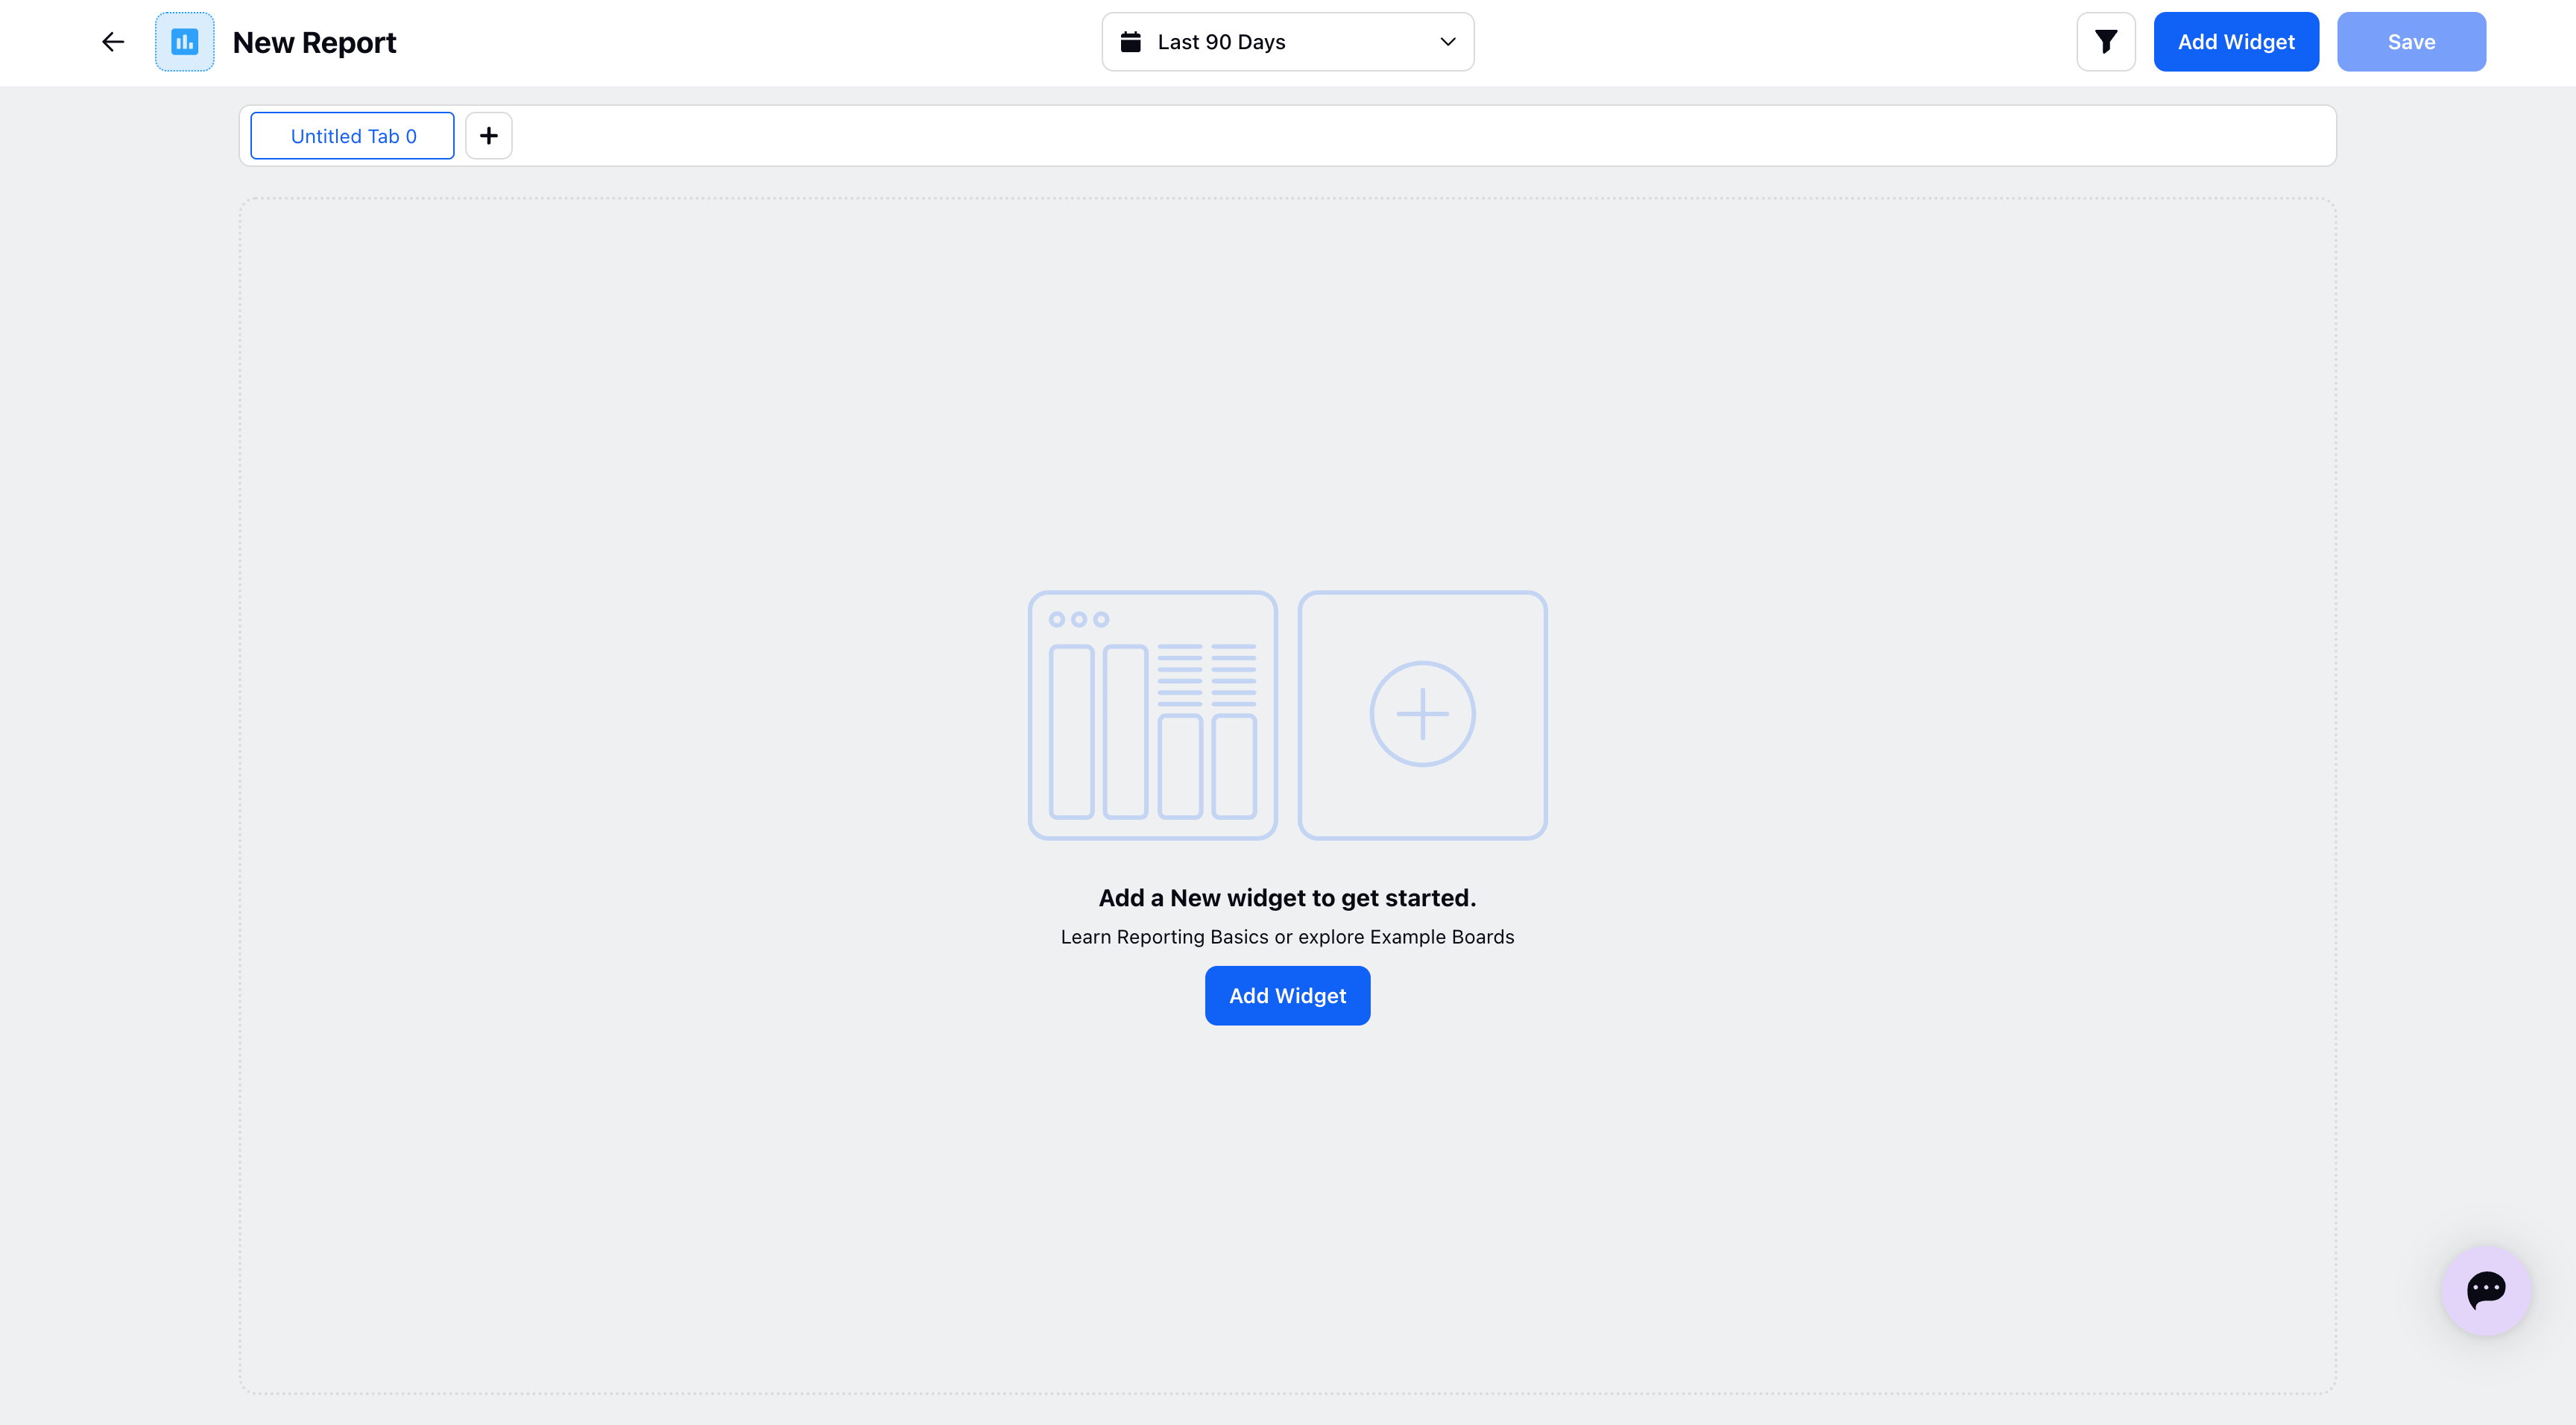
Click on 'Add Widget' to open Widget Builder.
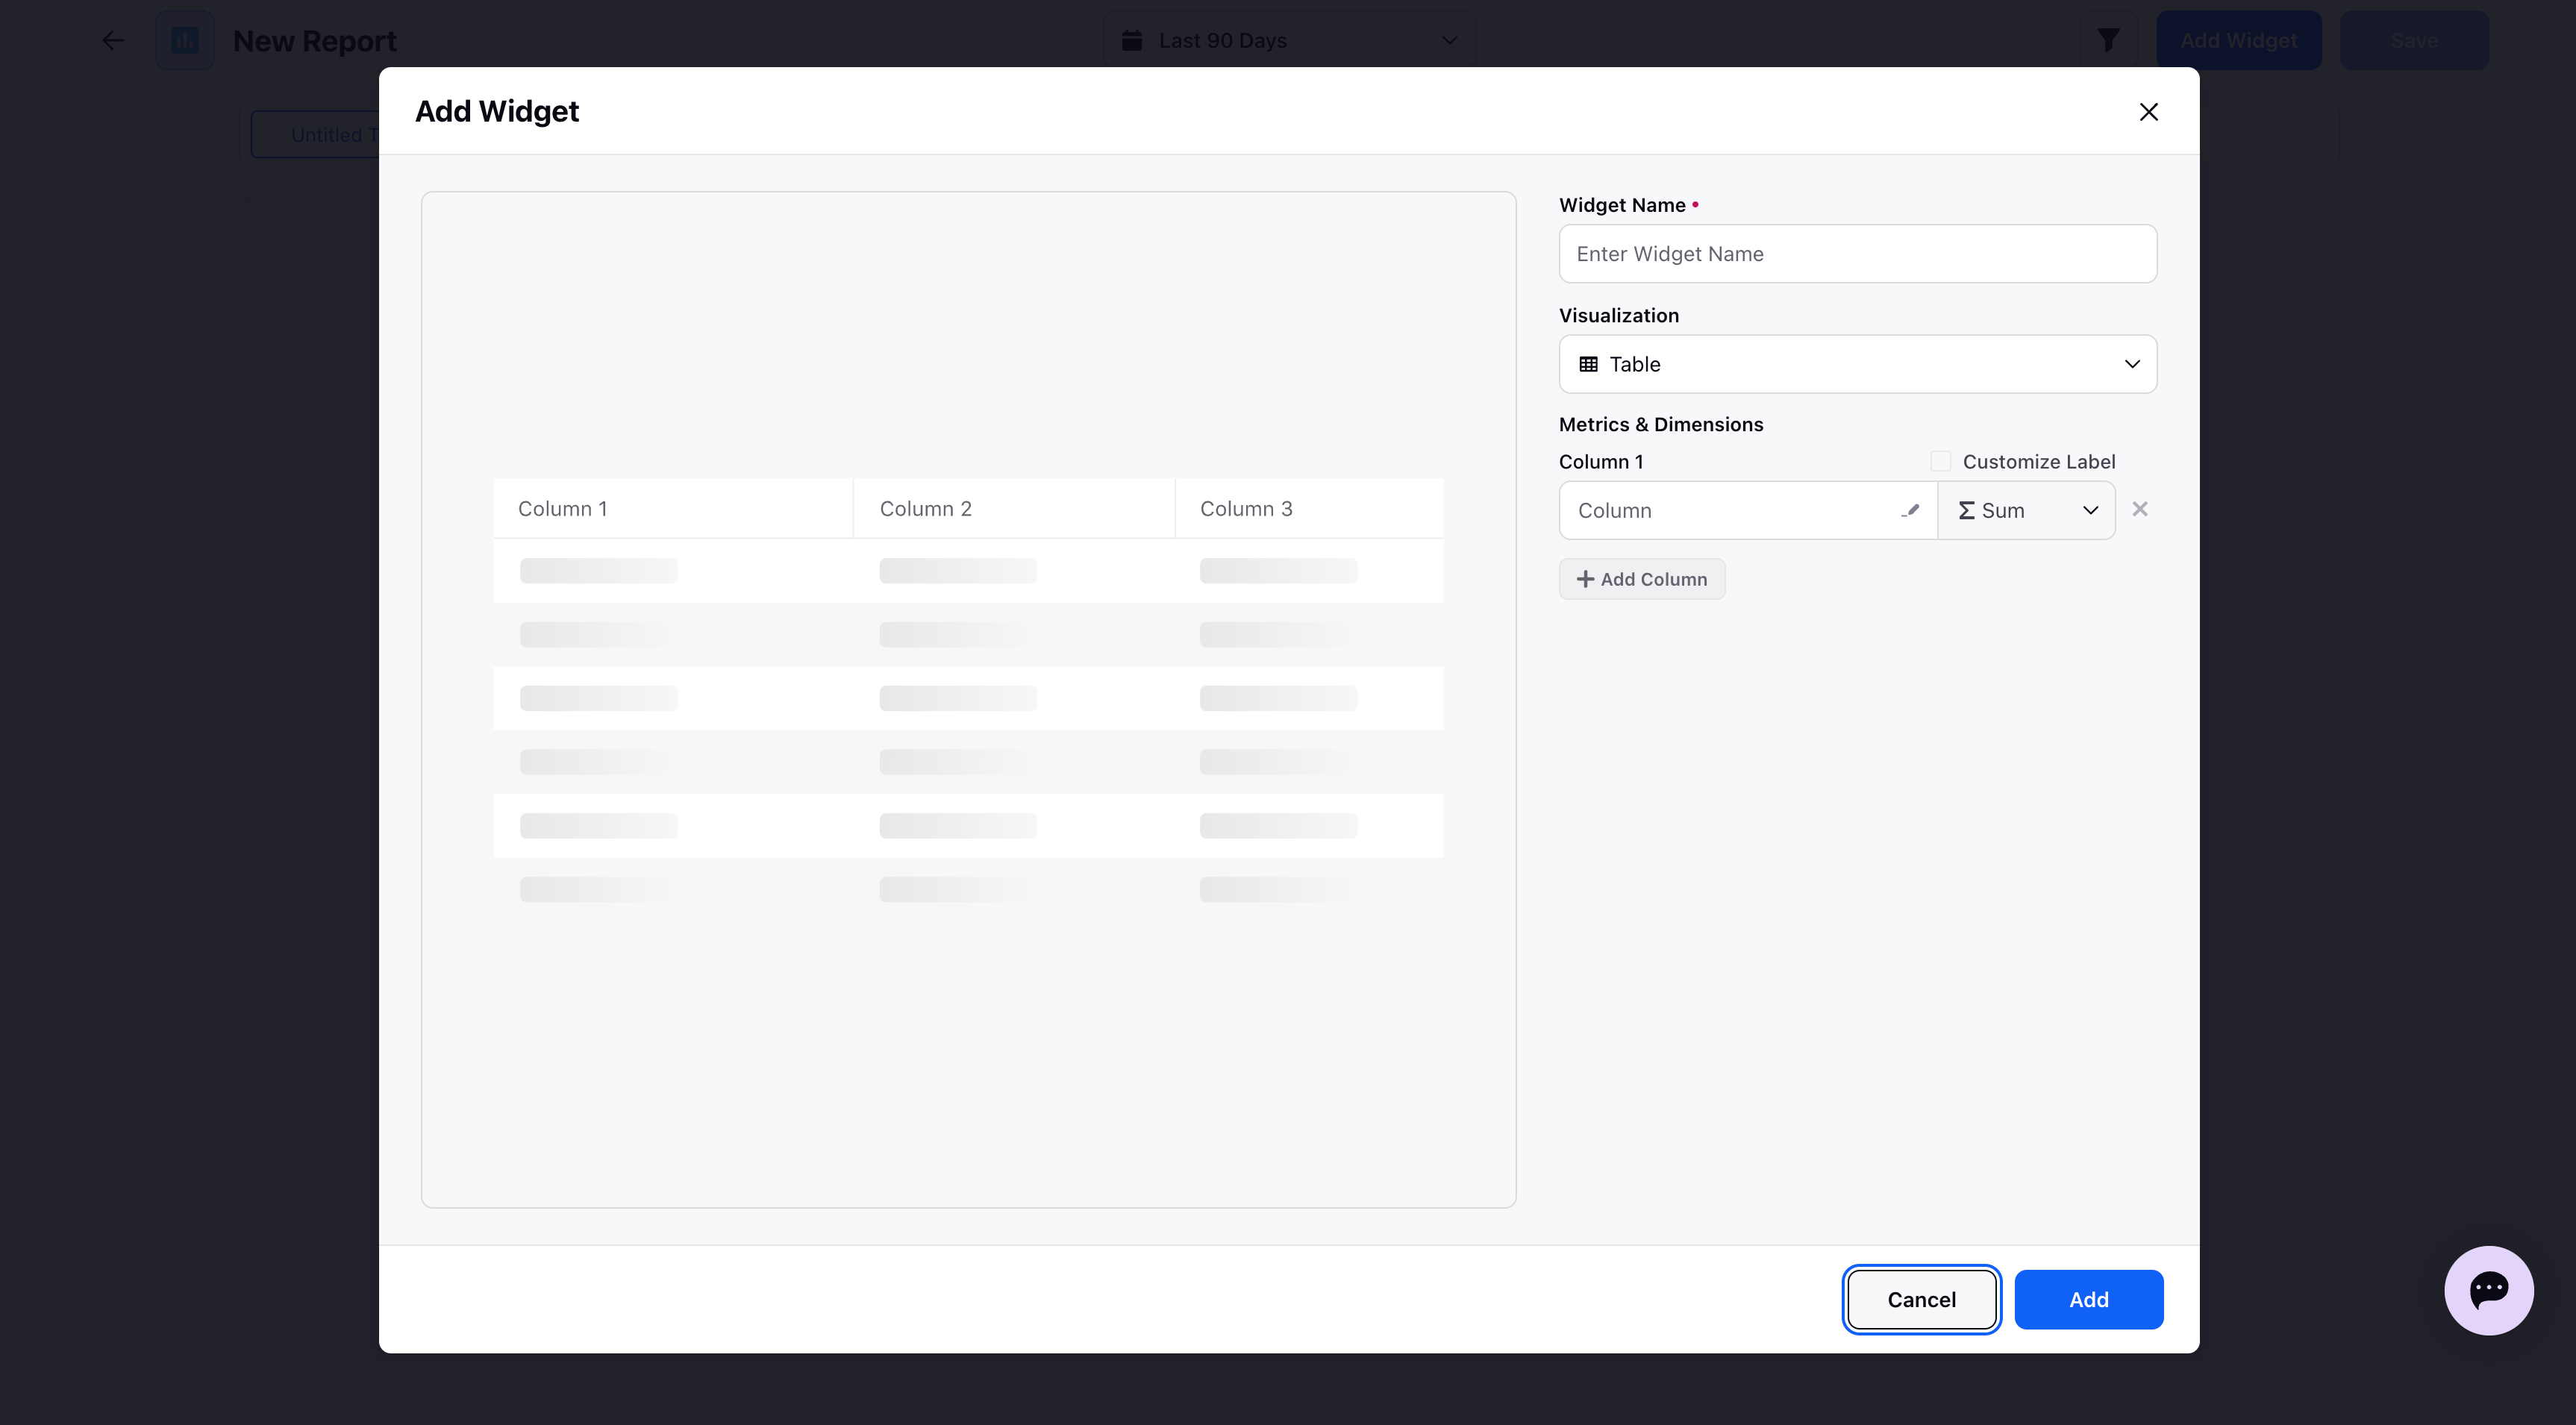
Provide a suitable widget name, choose the Visualization type such as Line, Bar, Pie, Column, etc. Under Metrics and Dimensions.
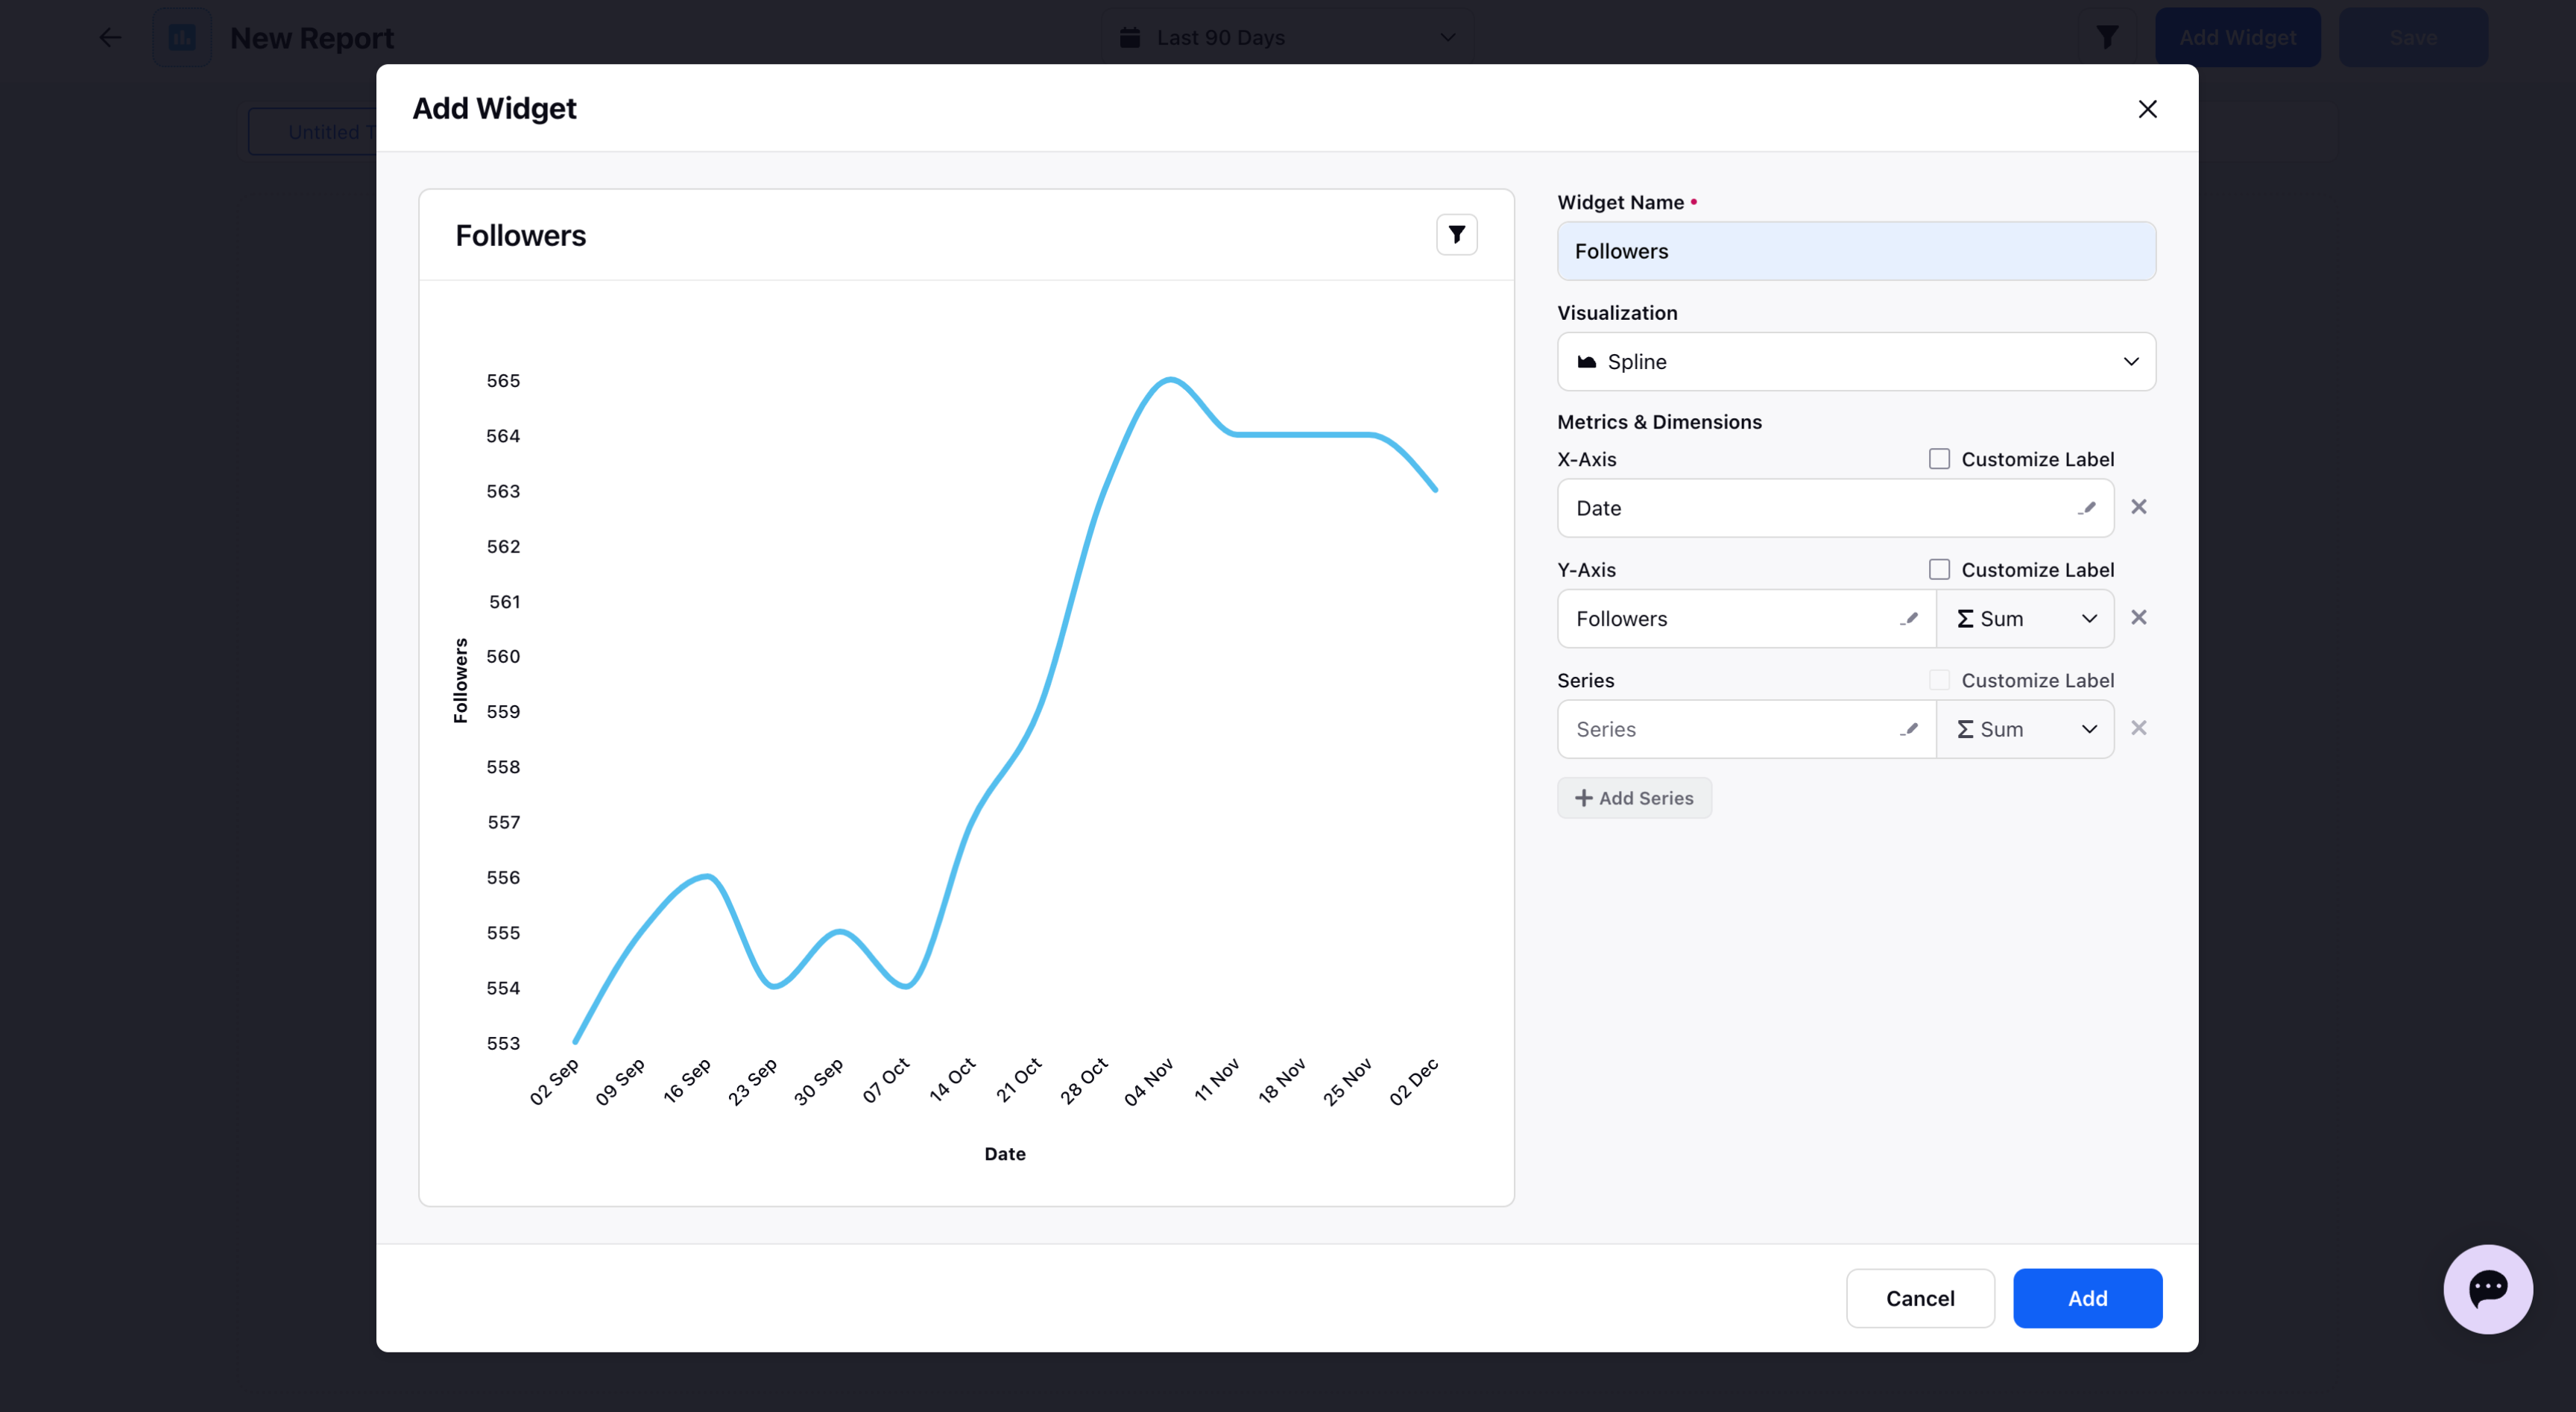
Once all the details are added, click 'Add' in the bottom right and the Widget will be added in the Canvas.
Click on the 3 dots icon against the widget to Edit, Duplicate, Resize, and Delete the widget.
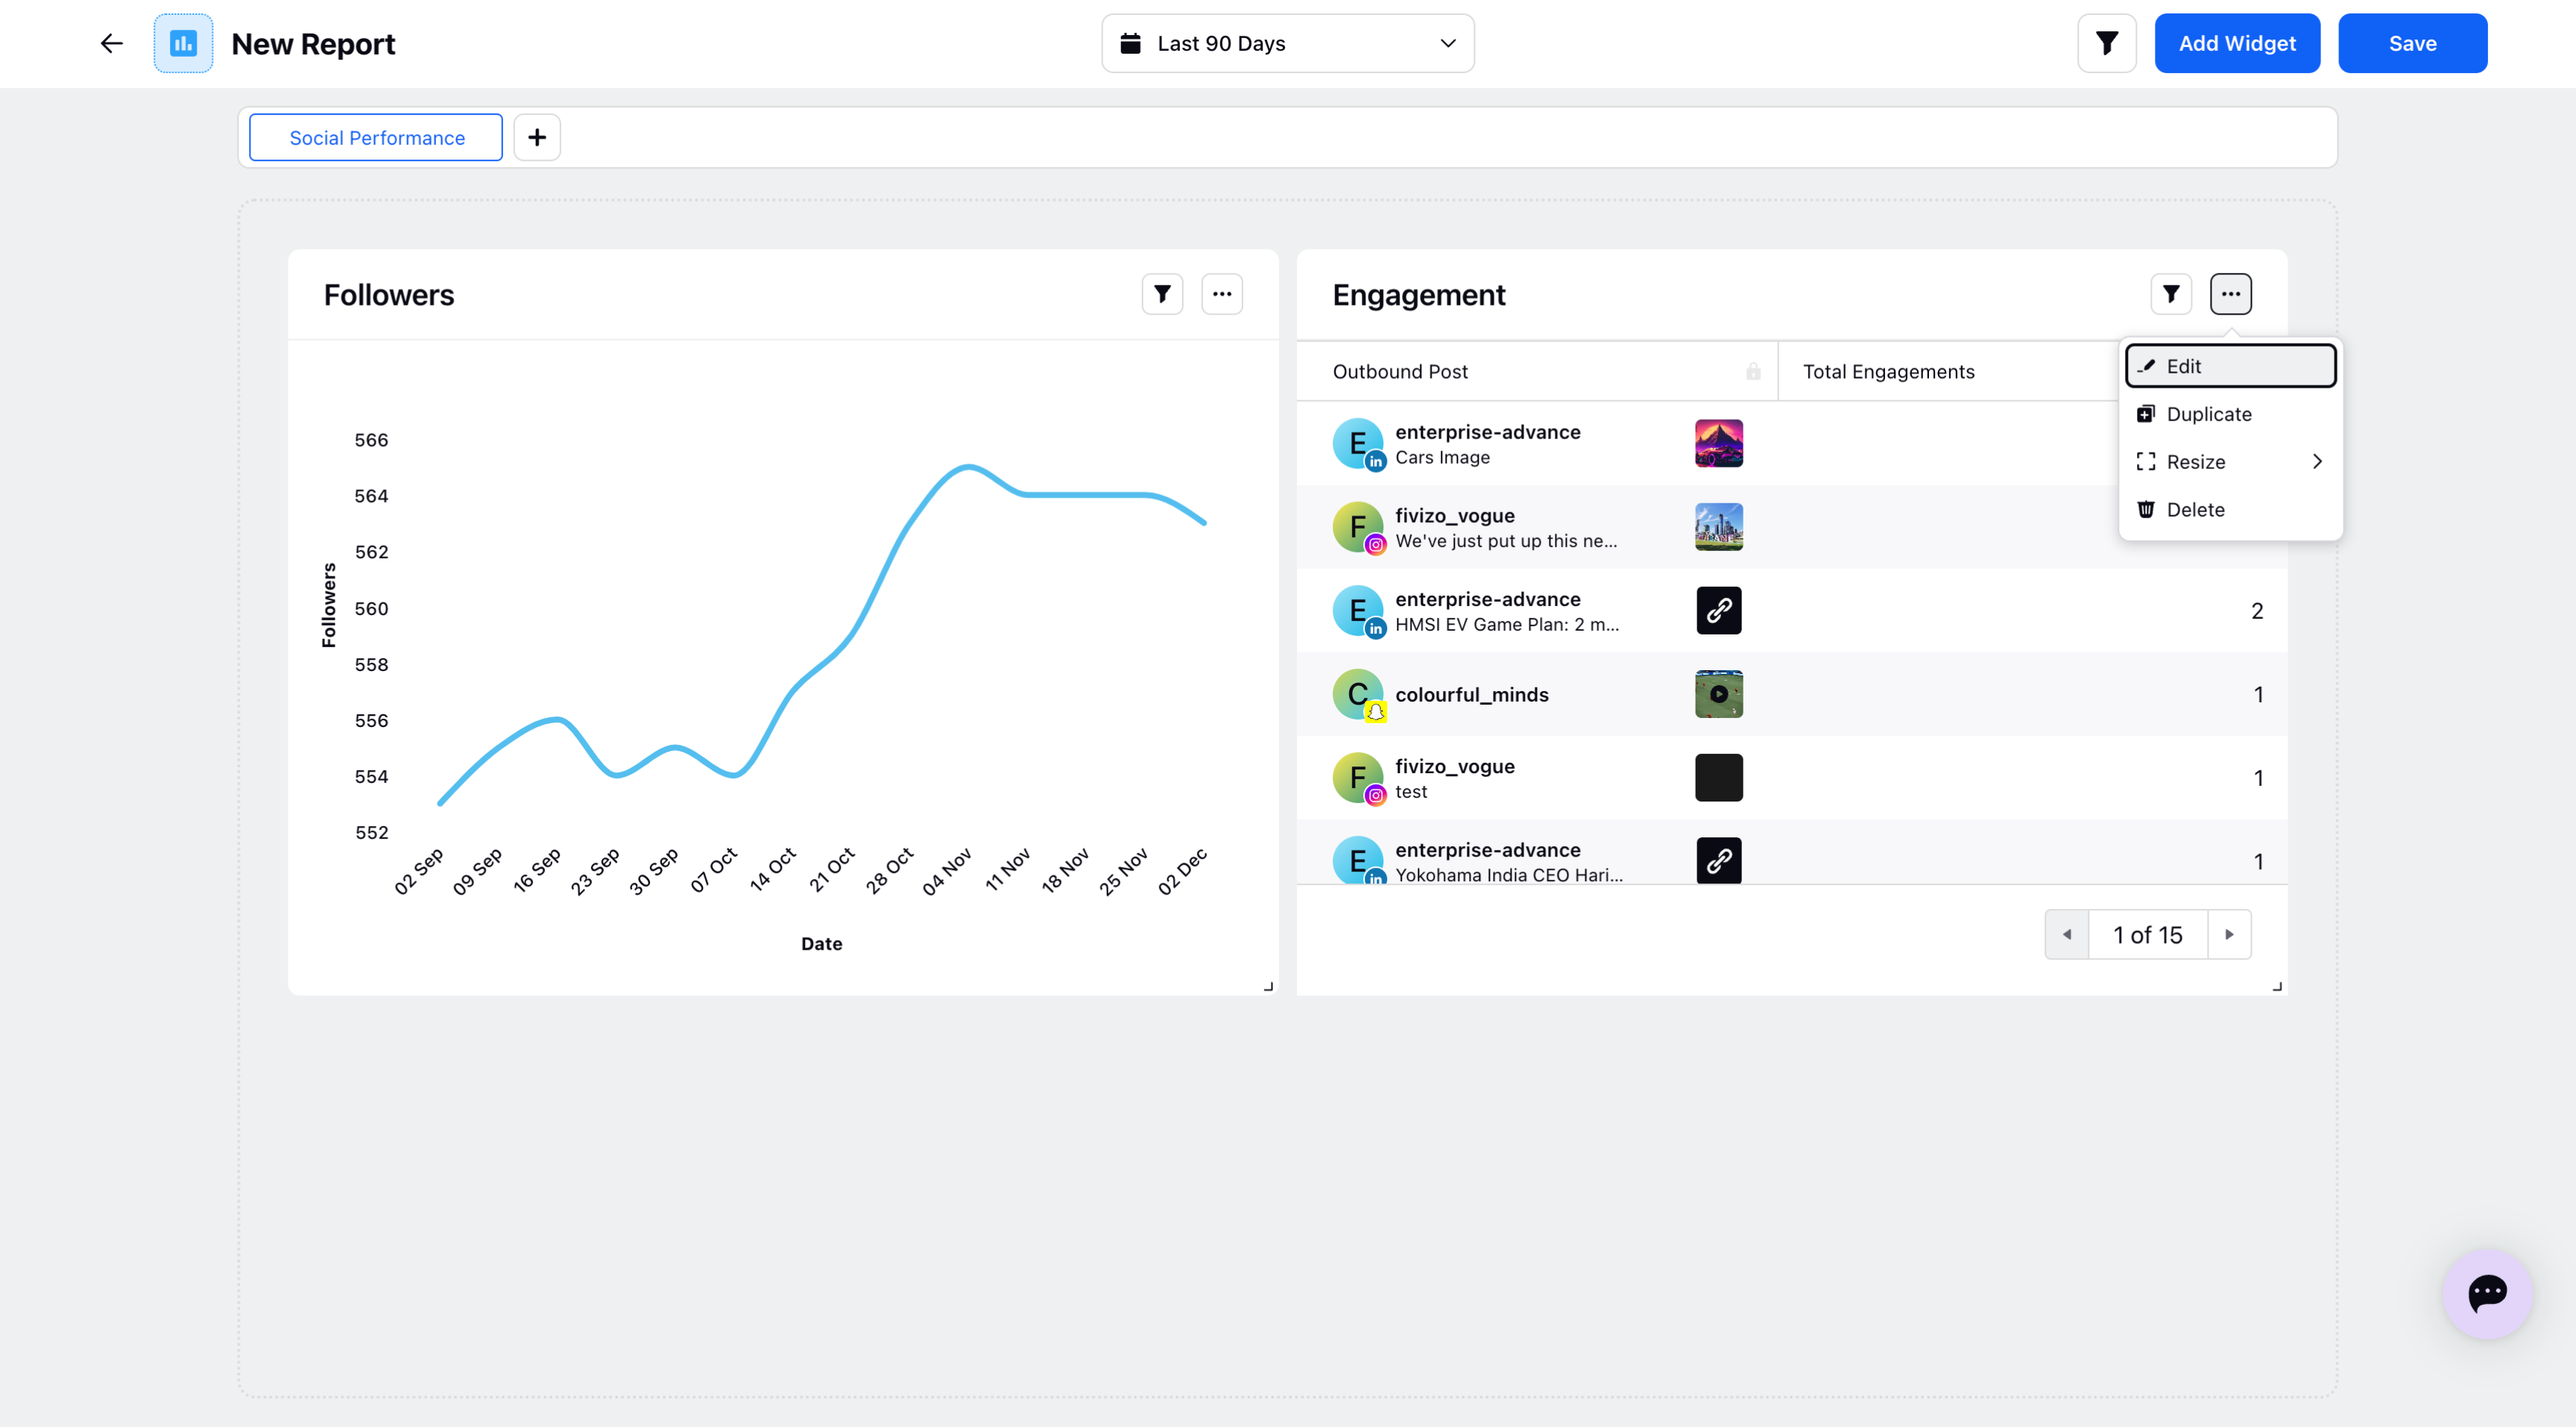
Edit: To Modify widget details.
Duplicate: To Create a copy of the widget.
Resize: To Adjust the widget size.
Delete: To Remove the widget.
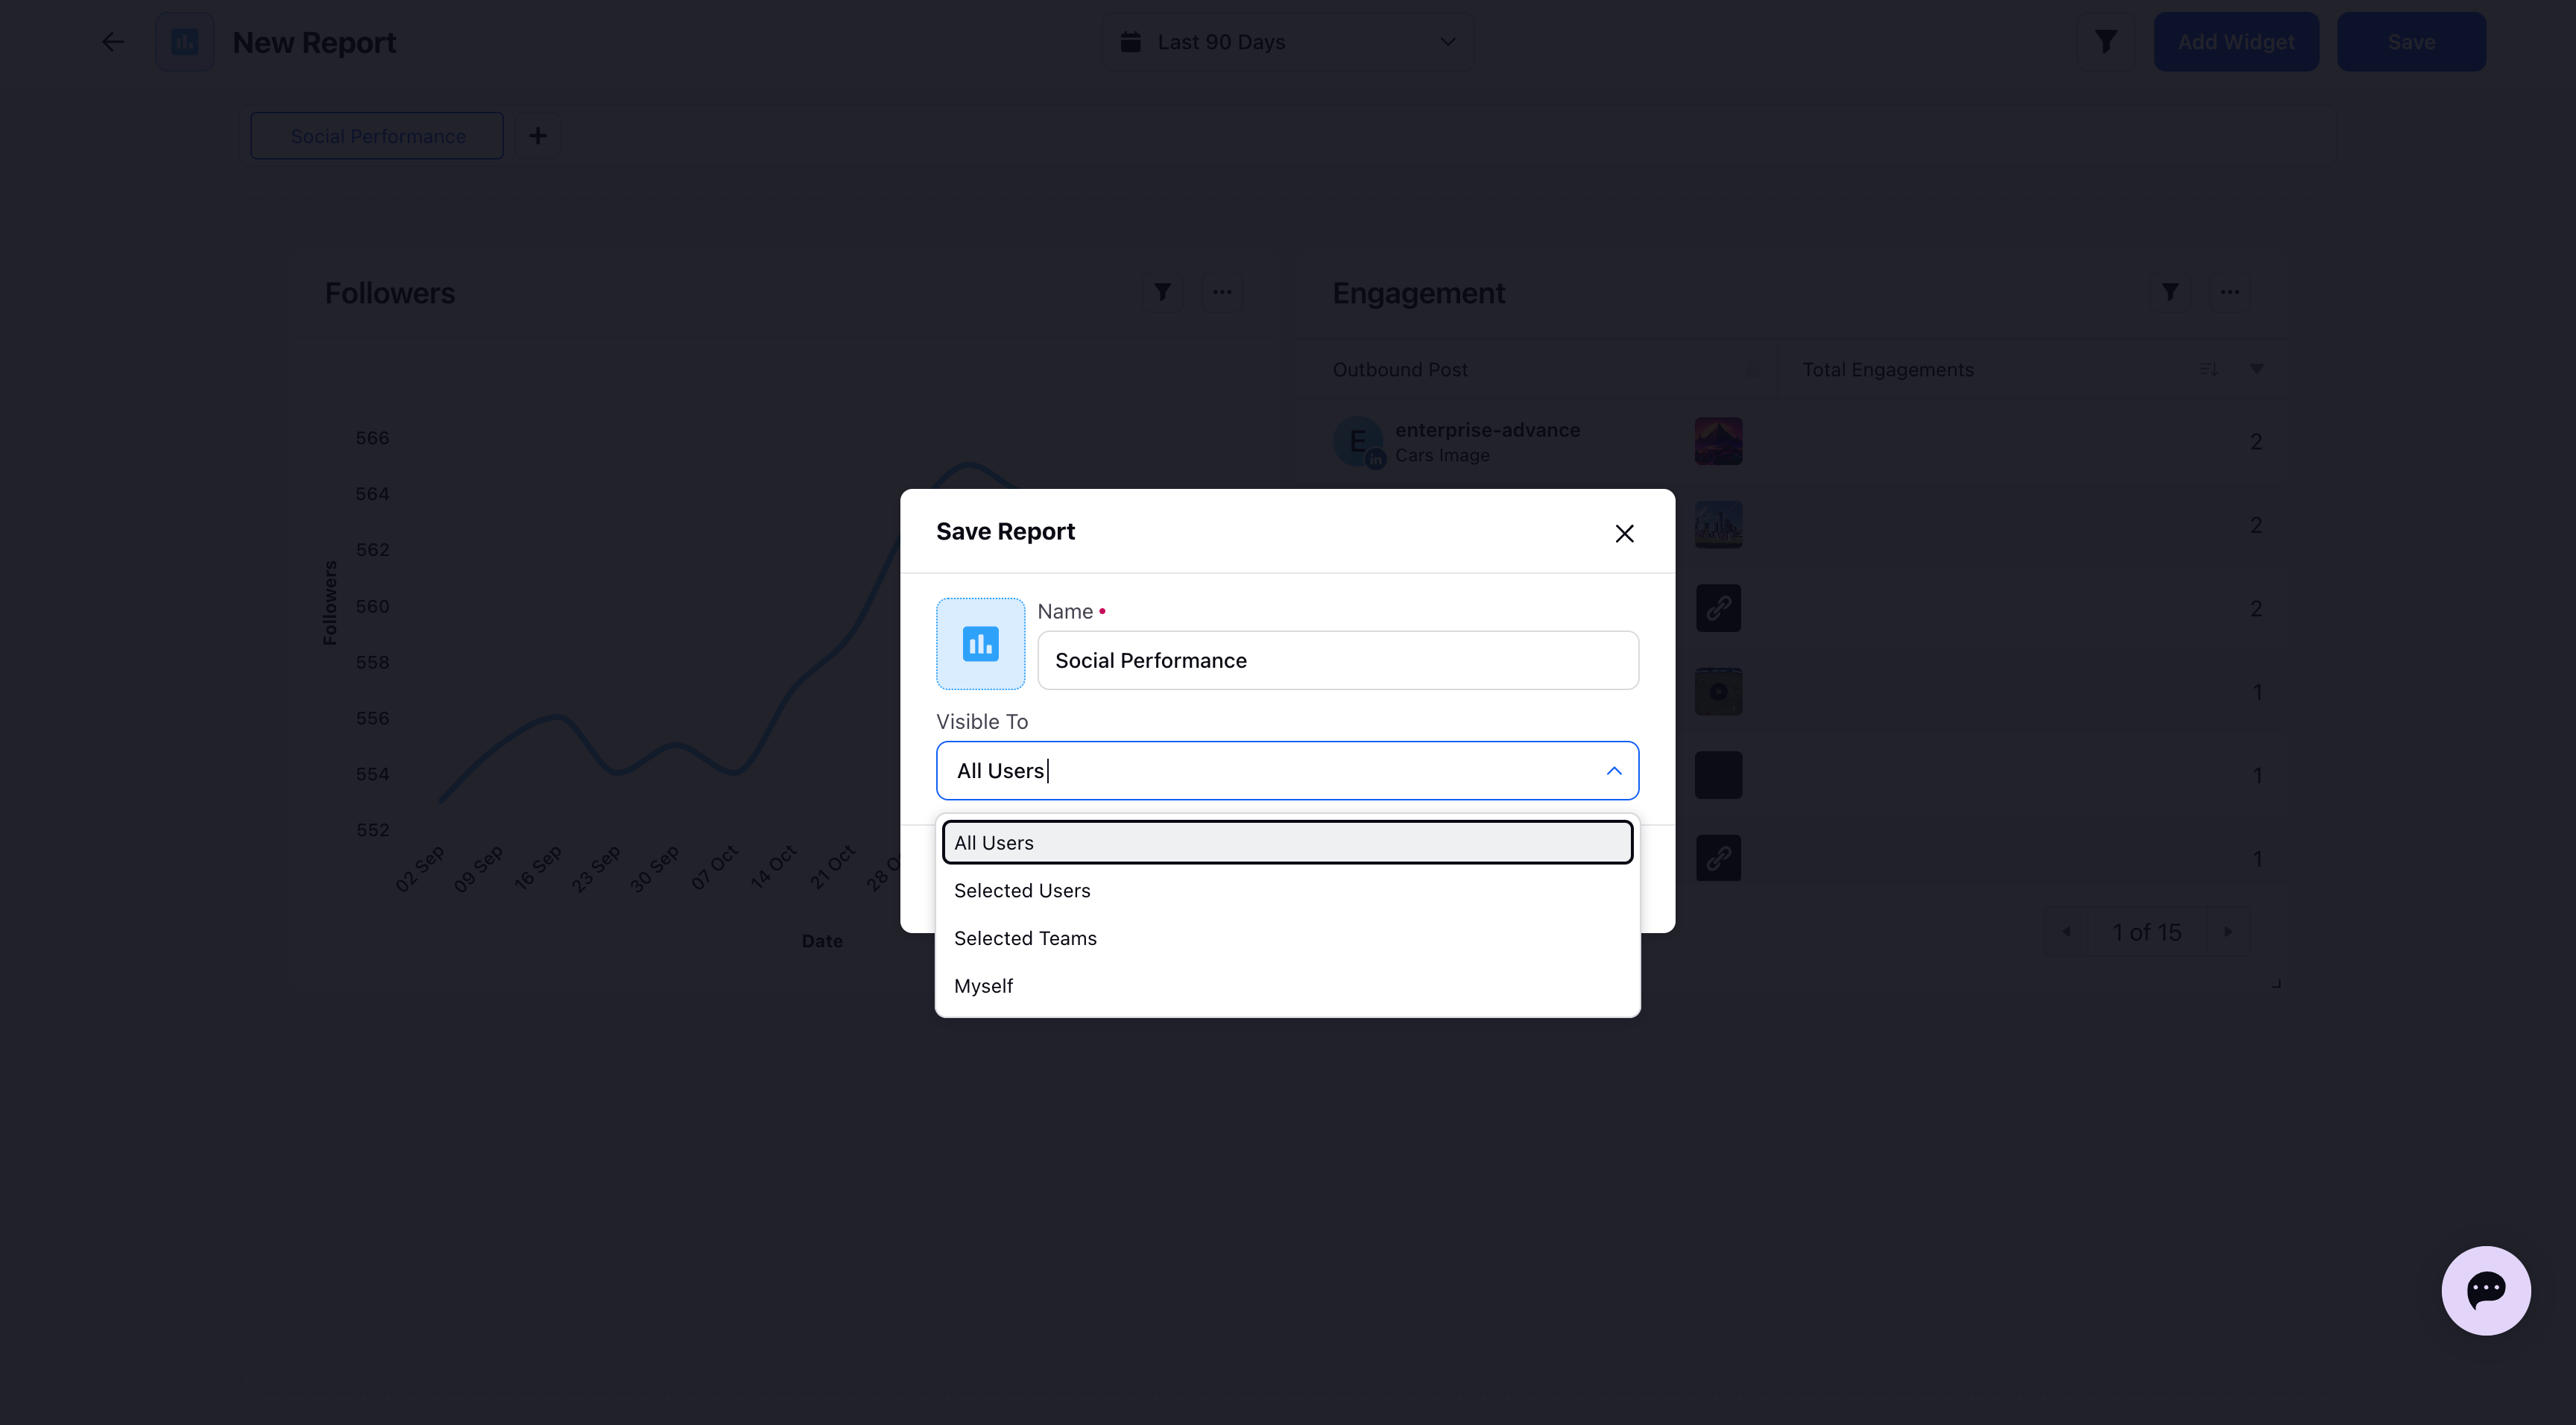
Click on 'Save' in the top right corner to save the dashboard. Provide a suitable dashboard name and specify the visibility settings (i.e., choose who can view the report).
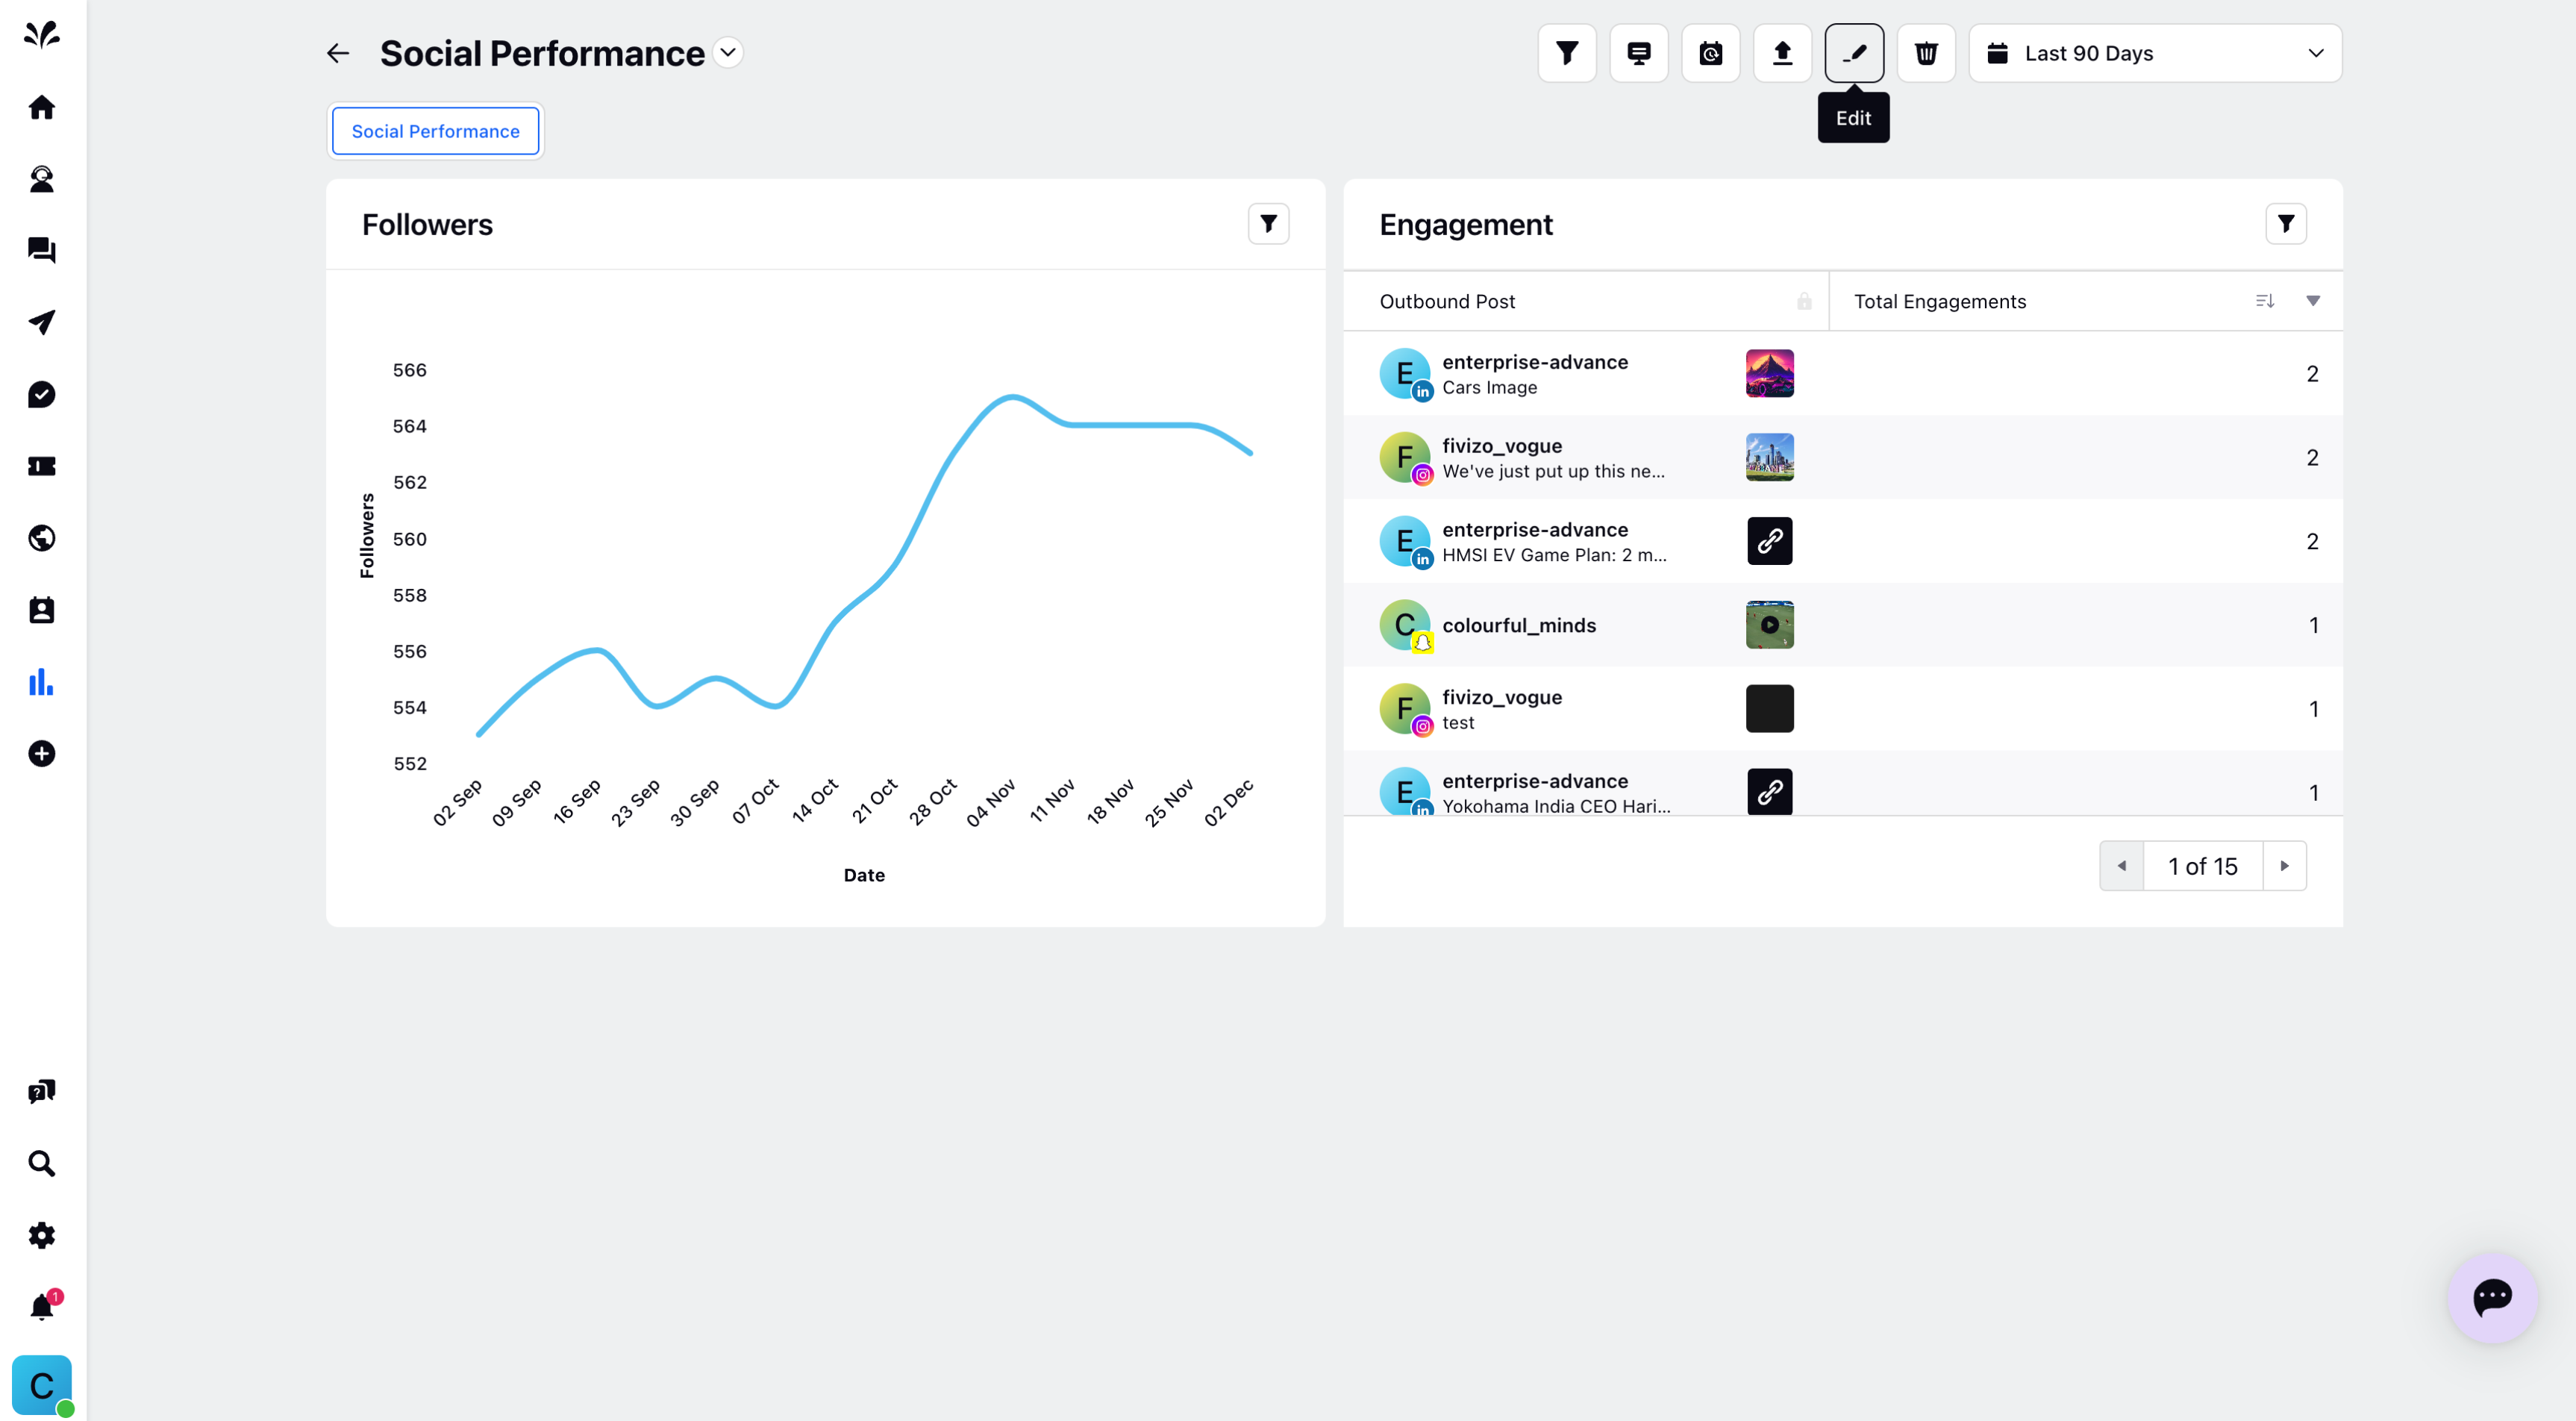
Once saved, the report enters View Only mode.
If you wish to make any changes you can click on the Edit icon.