
Make Informed Decisions with Sprinklr Service Reports
Updated
Make decisions that resonate with the growth of your brand/organization via unique and easy-to-use Sprinklr Service Reports.
Sprinklr Service enables you to perform sophisticated and innovative reporting and analytics on your customer support data and helps you make more informed, evidence-based decisions. You can view the set of curated reports for quick insights and build reports unique to your business via custom reporting using Sprinklr Service.
With Sprinklr Service Curated Reports, you can dig deep and understand the overall team performance. There are several Curated Reports such as SLA Monitoring, Ticket Analysis, Team Performance Overview, Customer Satisfaction Report, etc. These reports are curated in a way that helps you understand every aspect of your team’s performance.
Overview of the Reports window
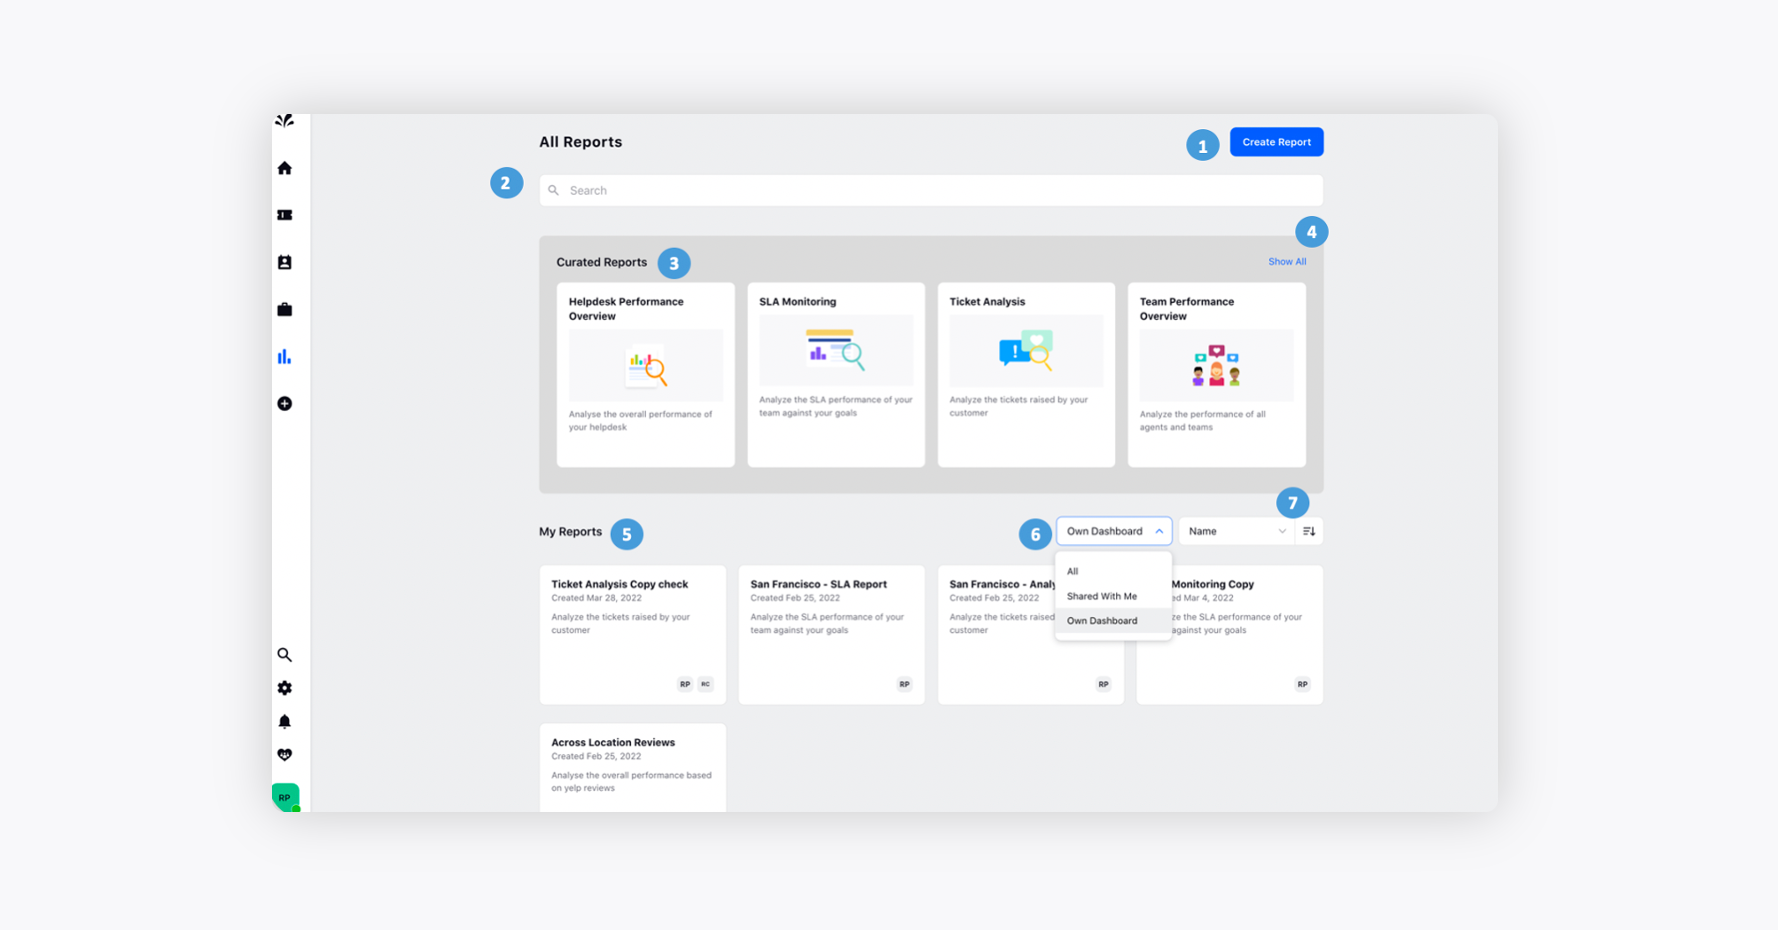
Reports window — overview
To create a Report
To learn how to create a report, click the link here.
Available actions on Reports
You can take the following actions on Reports in Sprinklr Service:
Filter Reports
Filtering allows you to better analyse your data. When a filter is applied to a Report, only the applicable data points that meet the filter criteria will display.
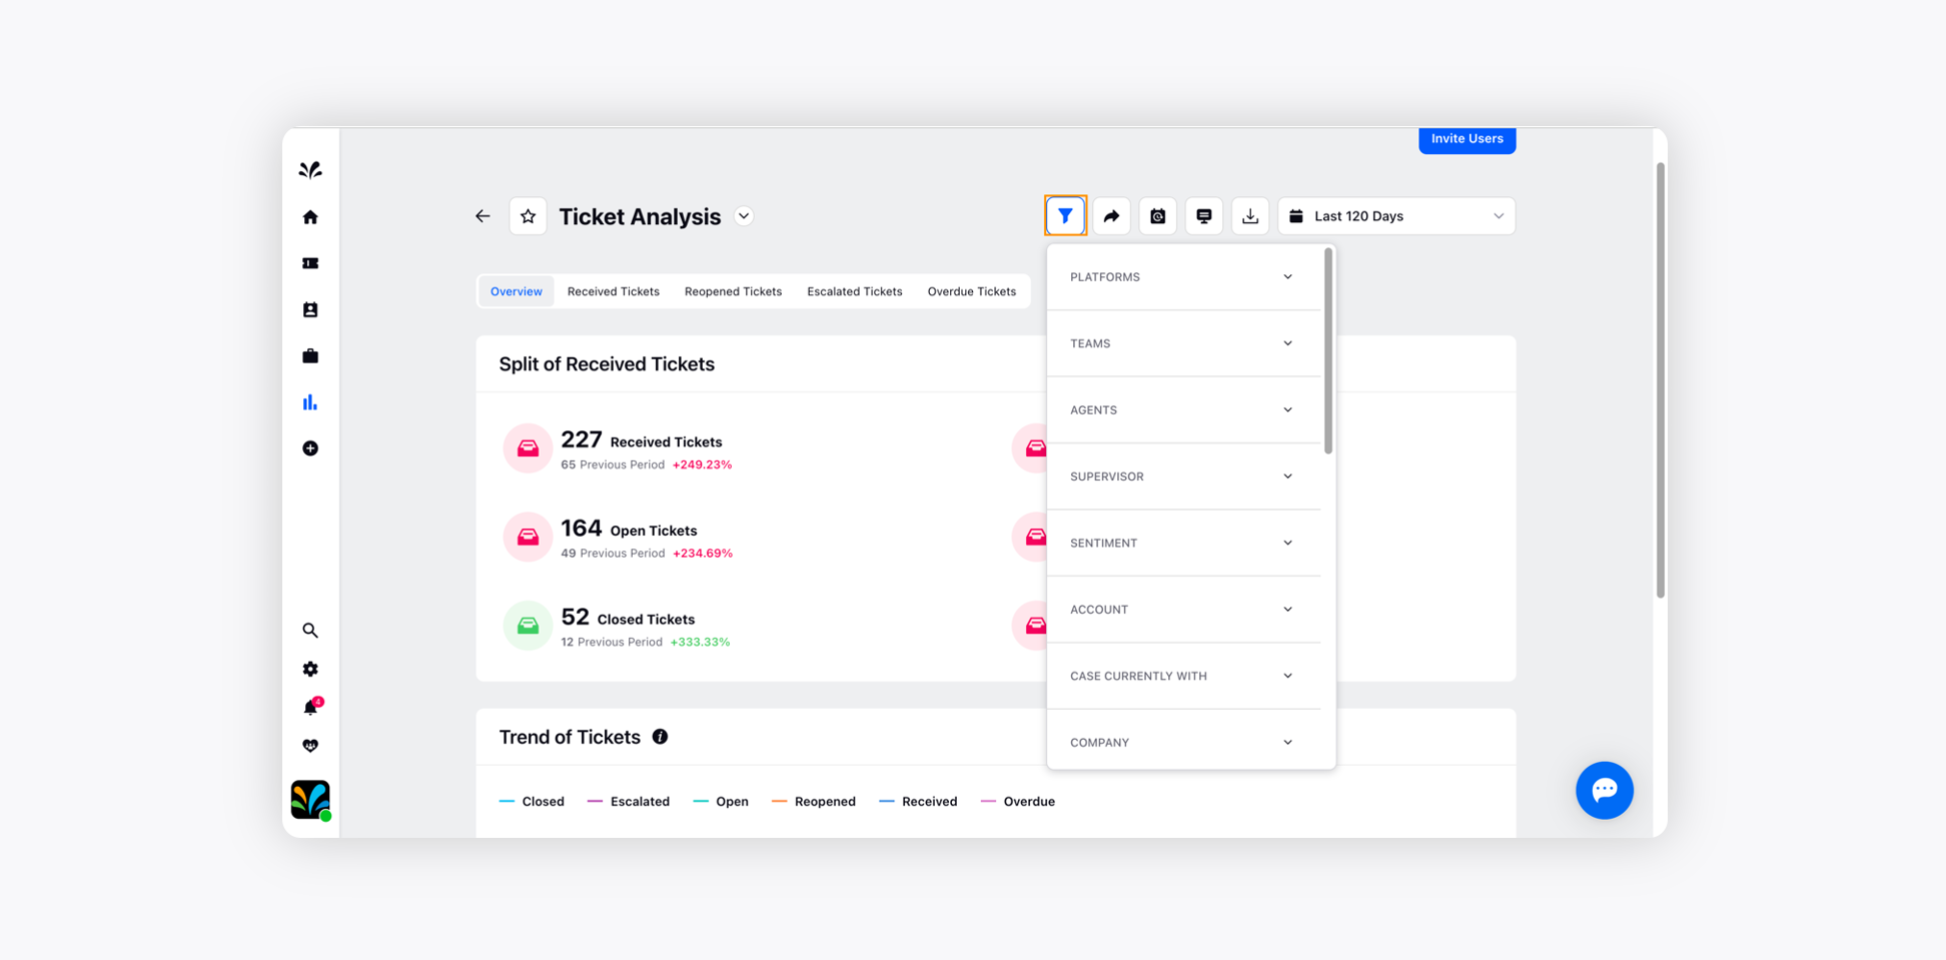
While filtering your data, you can use the default as well as custom filtering options. The supported default filters are:
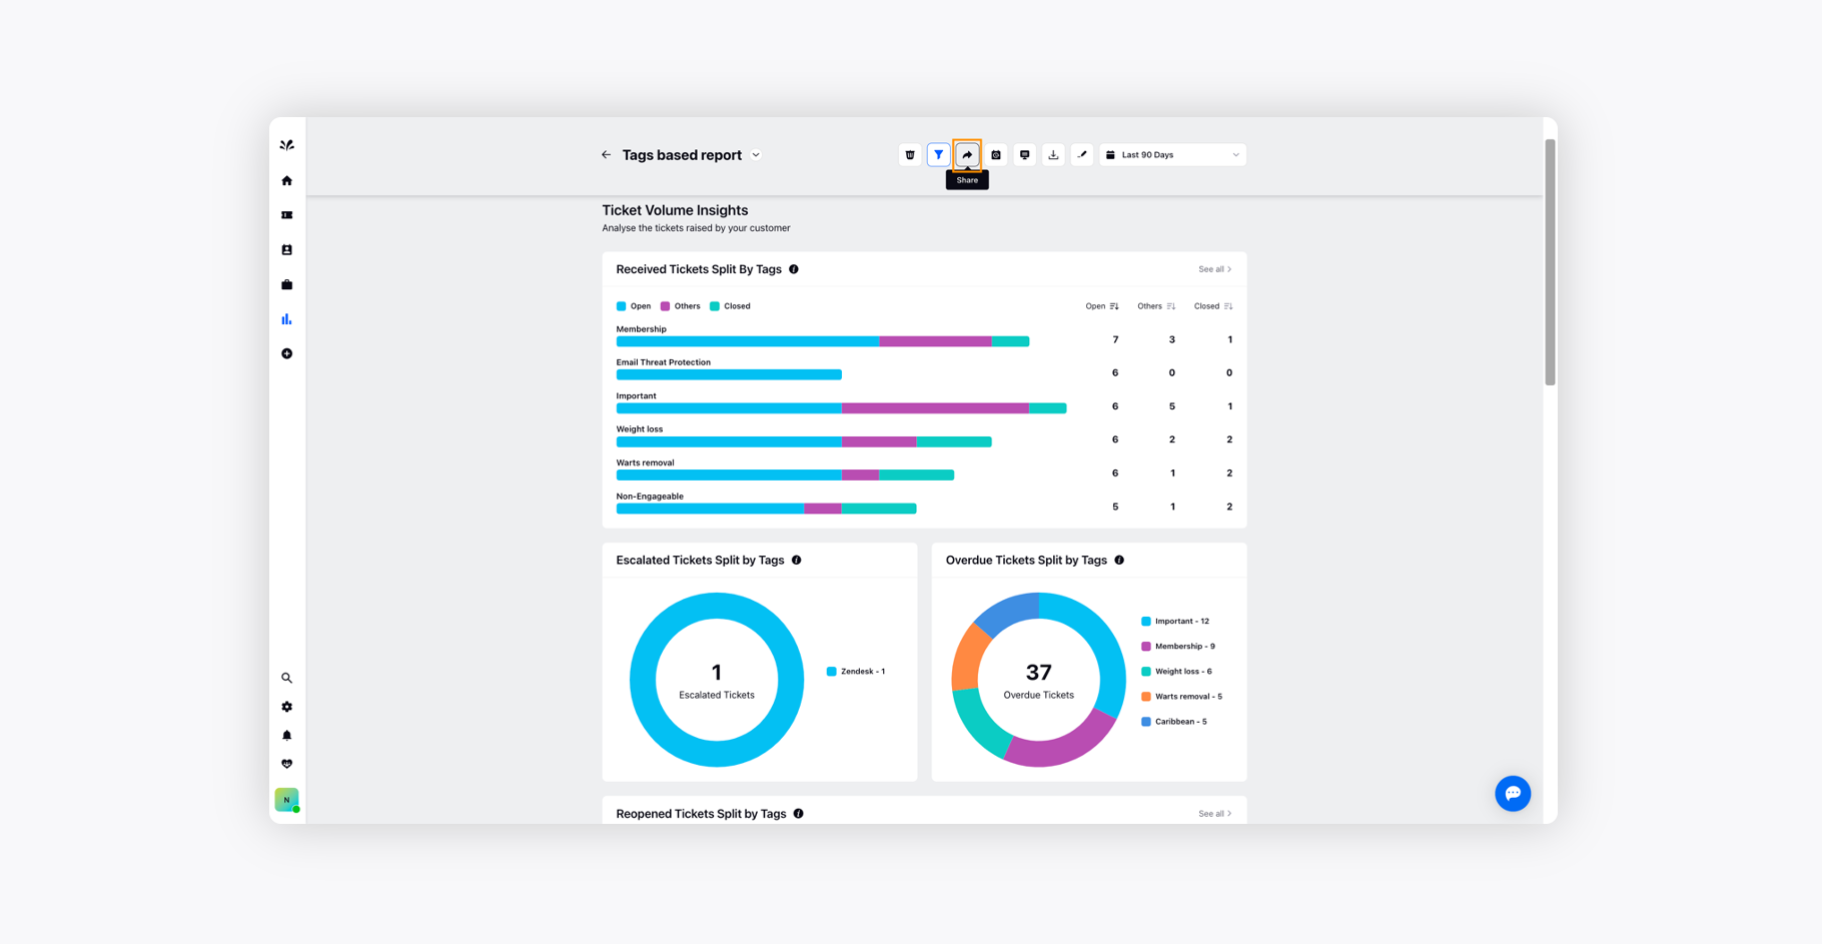
Share Reports
Share option enables you to share specific Reports with multiple stakeholders within your organisation or out of your organisation to their email addresses.
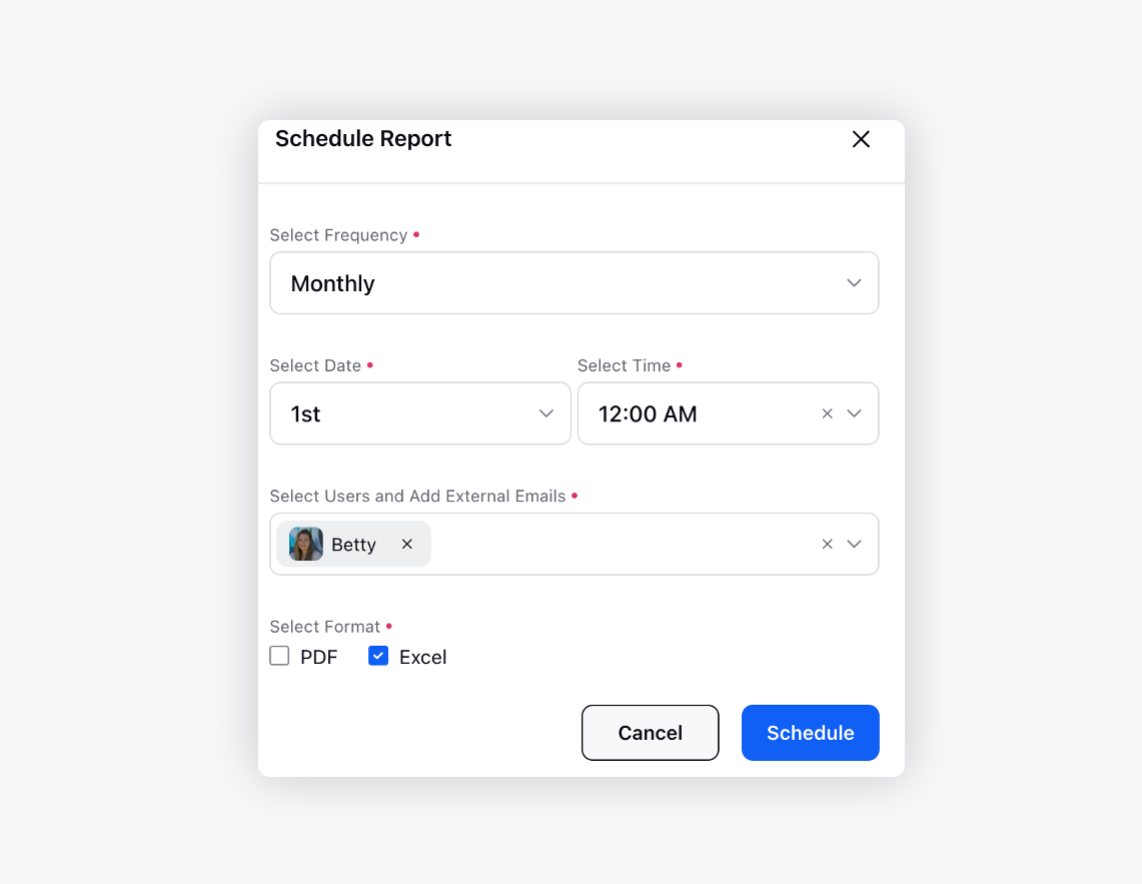
Schedule Exports of Reports
With the Schedule Exports capability, you can schedule the regular export of reports to stakeholders within your organisation or to external email addresses.
On the Curated Reports window, click the Schedule Export icon.
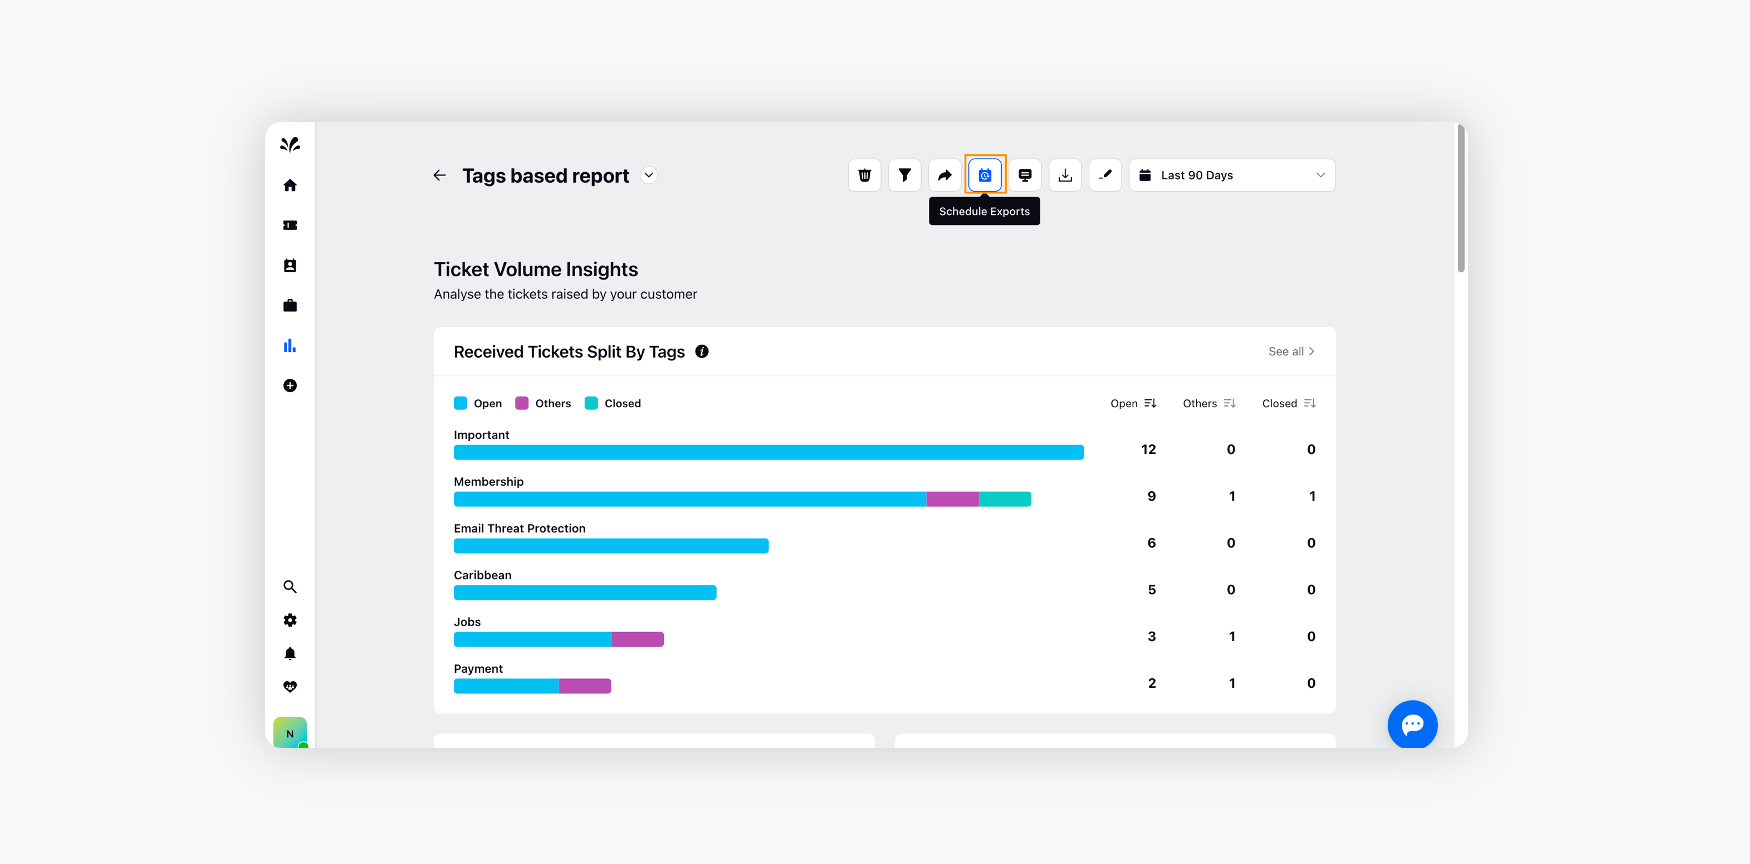
On the Schedule Report pop-up window, select the Frequency of export, configure the Date and Time, select the users you want to export the data to, and select the export Format. Click Schedule.
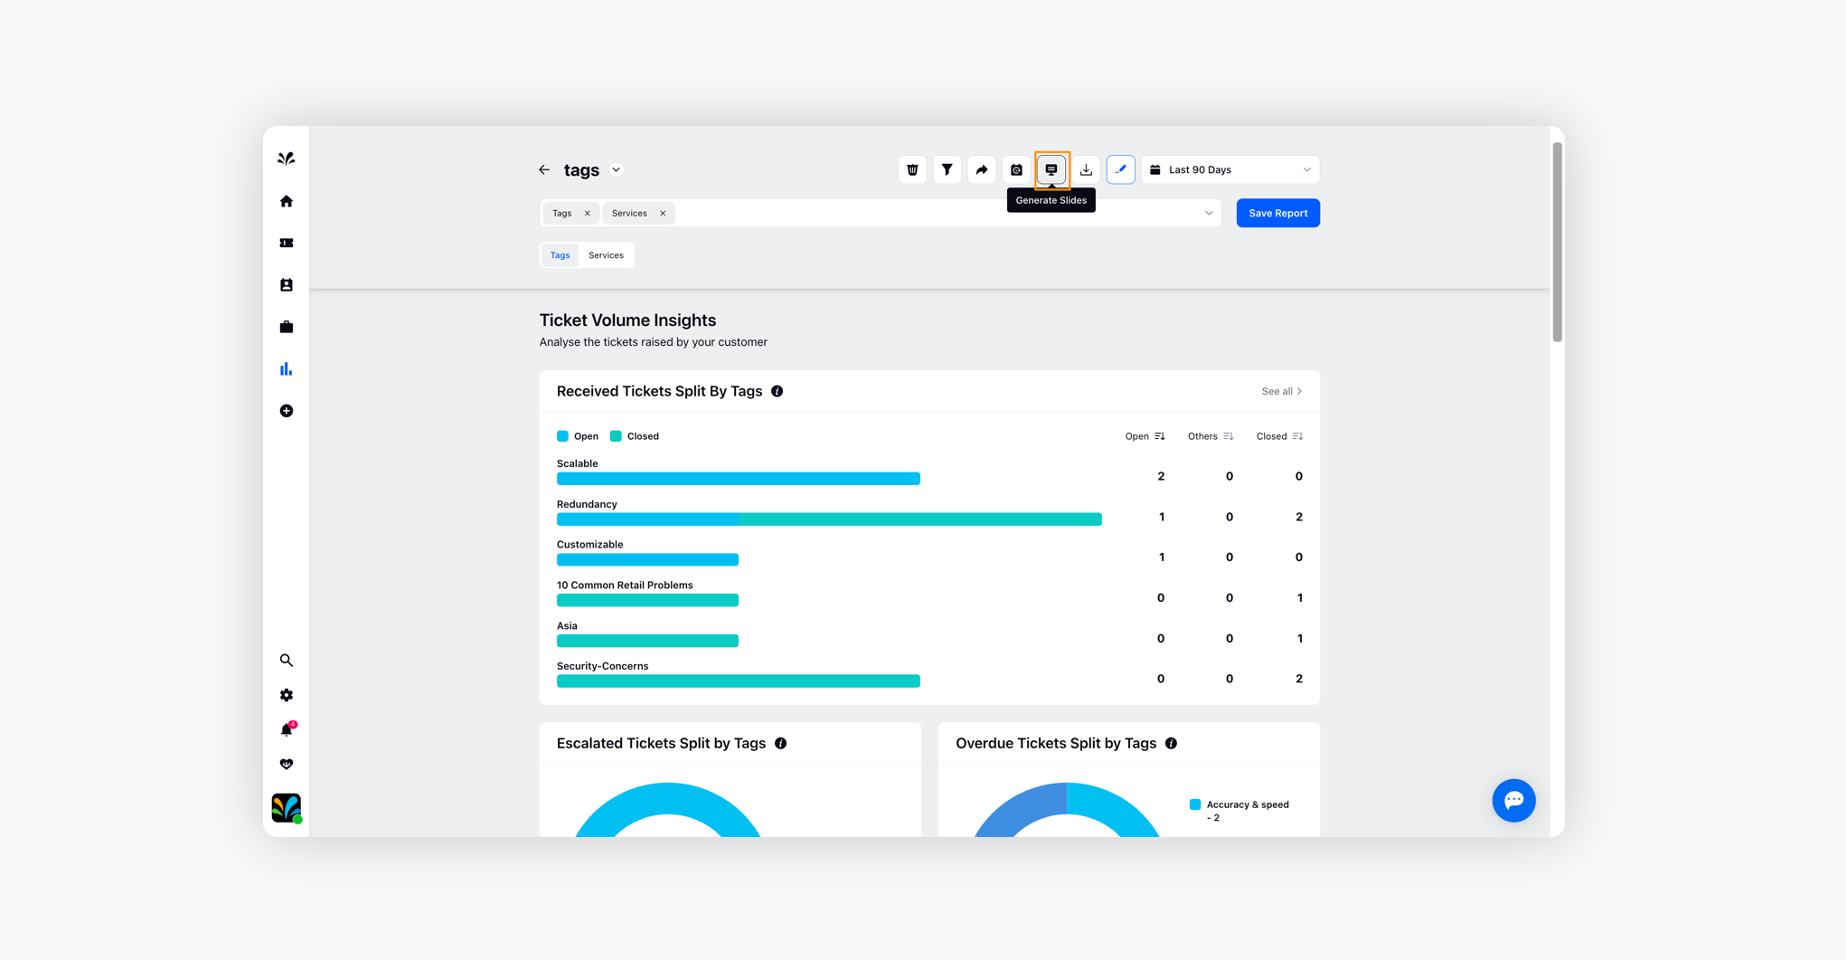
Generate Slides
Generating slides is a great way to share your reports with other associates who are not part of Sprinklr. These slides are available to view for anyone with the link, and the data keeps on updating in real time. So, you don't have to share the same report multiple times, and your associates can just visit the link anytime to view the latest data.
Click the Generate Slides icon to generate slides of your reports. The slides will open in a new window. You can also view the Slides in Full Screen, Download them as PDFs, and Share the URLs externally.
Export Reports
Click the Export icon to export your slides in Excel or PDF file formats.
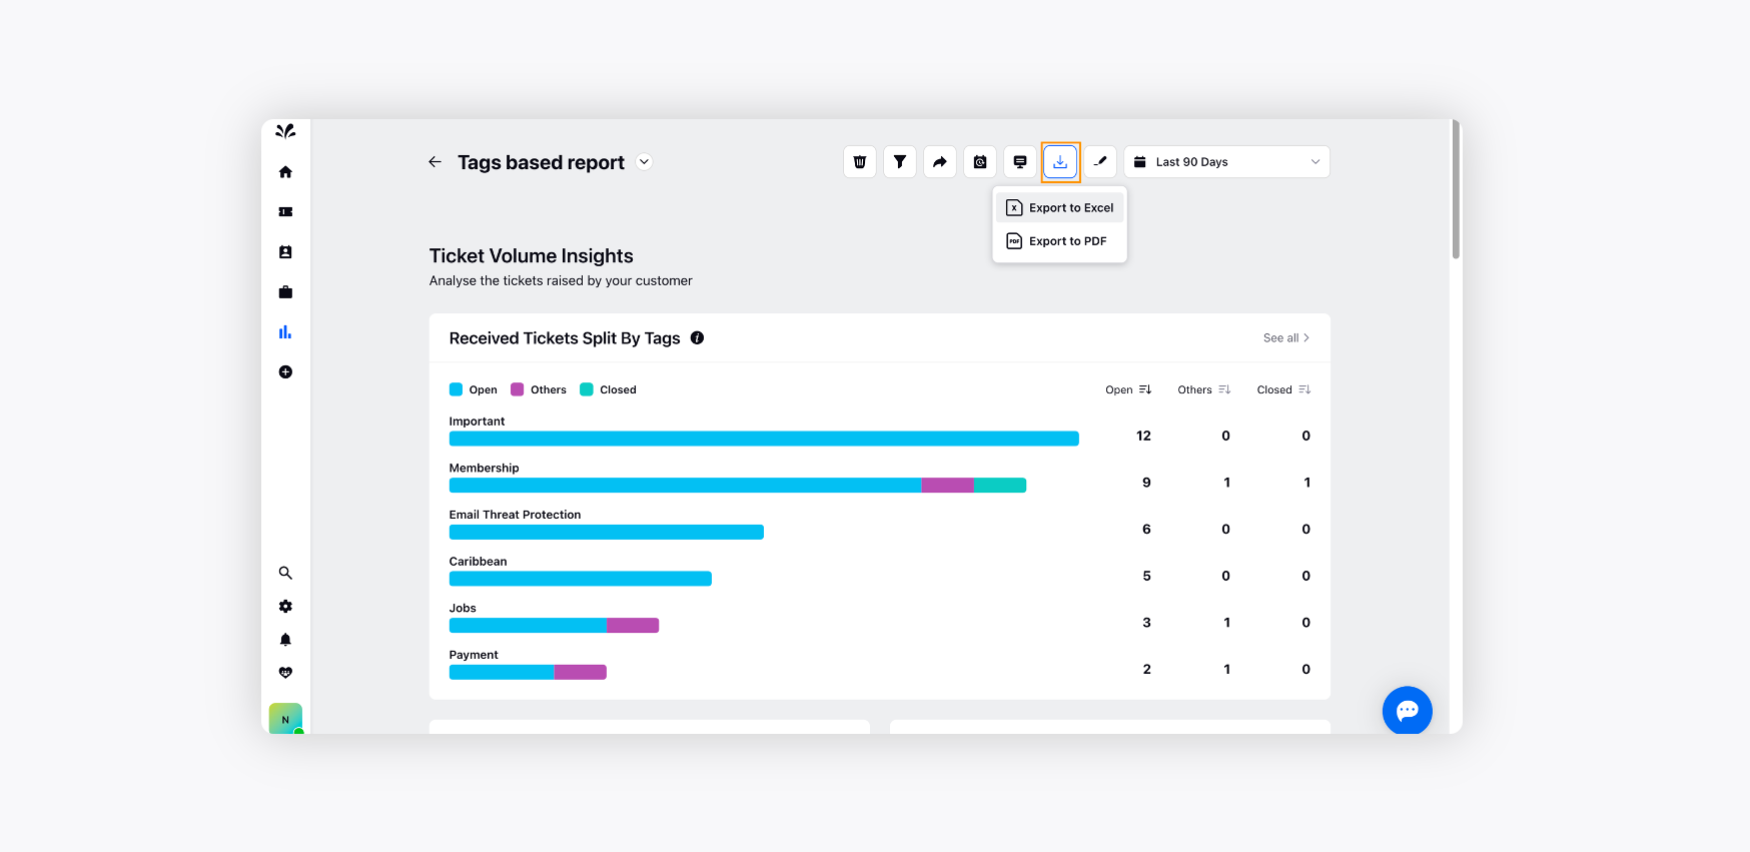
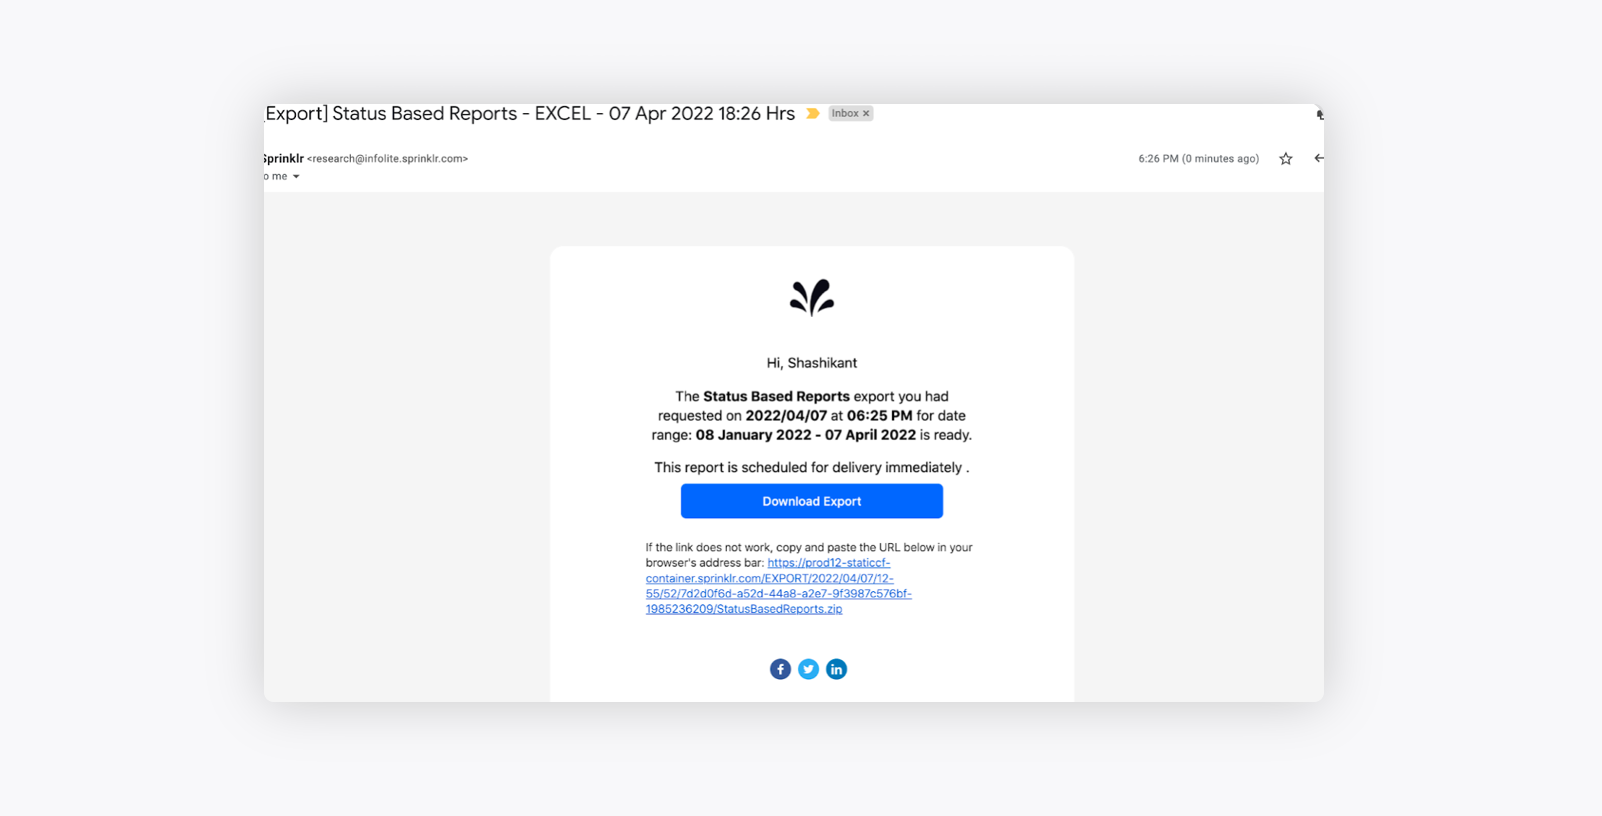
Export to Excel - If you select Export to Excel, you will receive an email with a subject consisting of your report name and the export timing. You can further download and use that data.
Export to PDF - If you select Export to PDF, a pdf file will be downloaded to your downloads folder in your system.
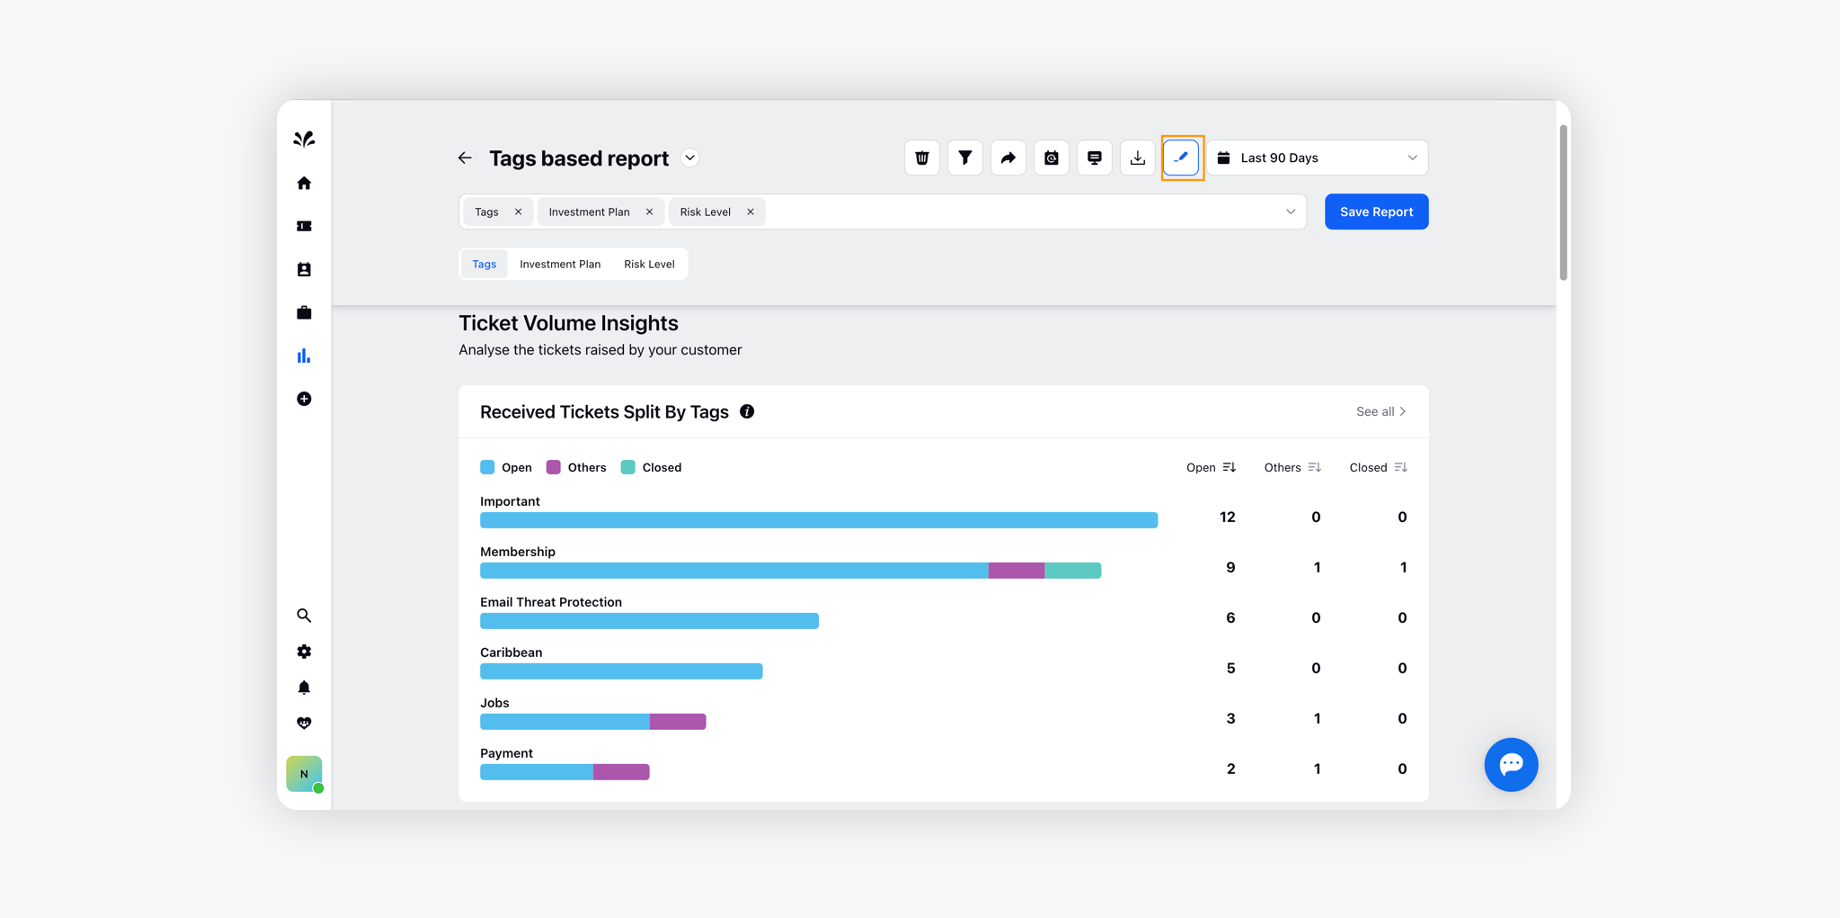
Edit a Report
This option allows you to edit your existing report and add/remove the desired dimensions.
Click the Edit icon on your Custom Reporting Dashboard, change the Dimension and click Save.
Reporting Range
Reporting Range option enables you to define data intervals and helps group results into ranges or buckets. You can also specify Custom Range for your report.
On Reporting Dashboard, click the Reporting Range drop-down menu.
Select from the default reporting time ranges, i.e., Today, Last 24 Hours, Last 7 Days, Last 30 Days, Last 60 Days, Last 90 Days, and Last 120 Days.
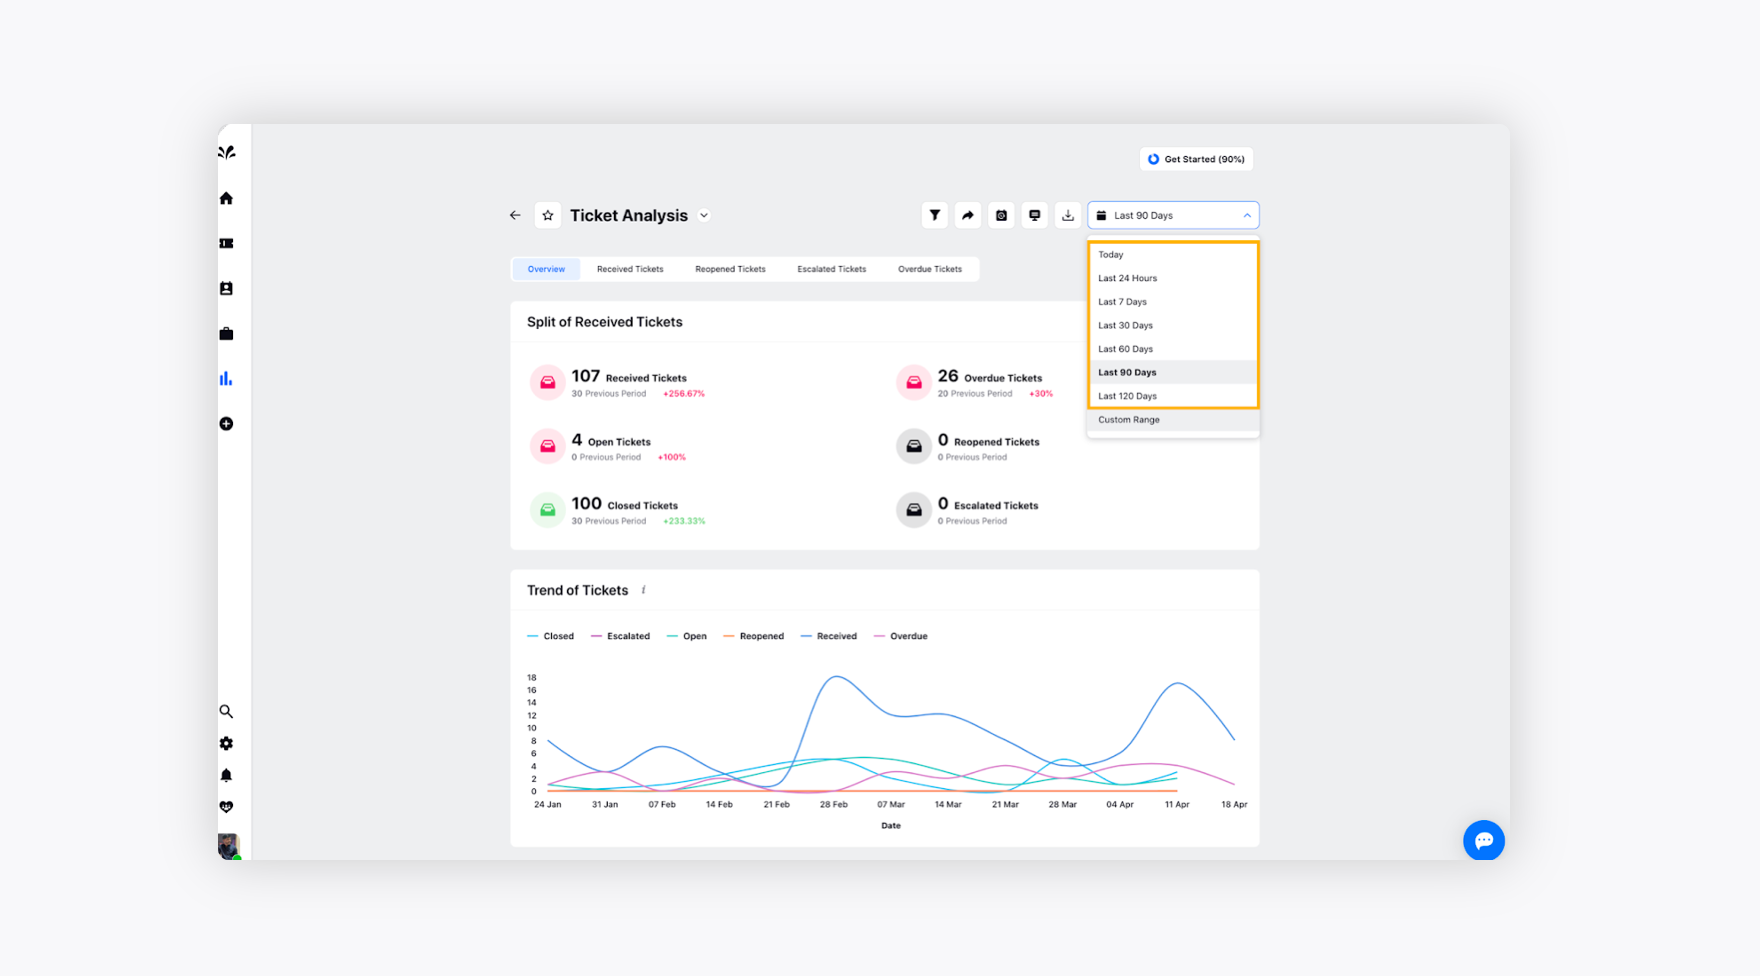
Select Custom Range, if you want to filter reporting data based on your desired time range.
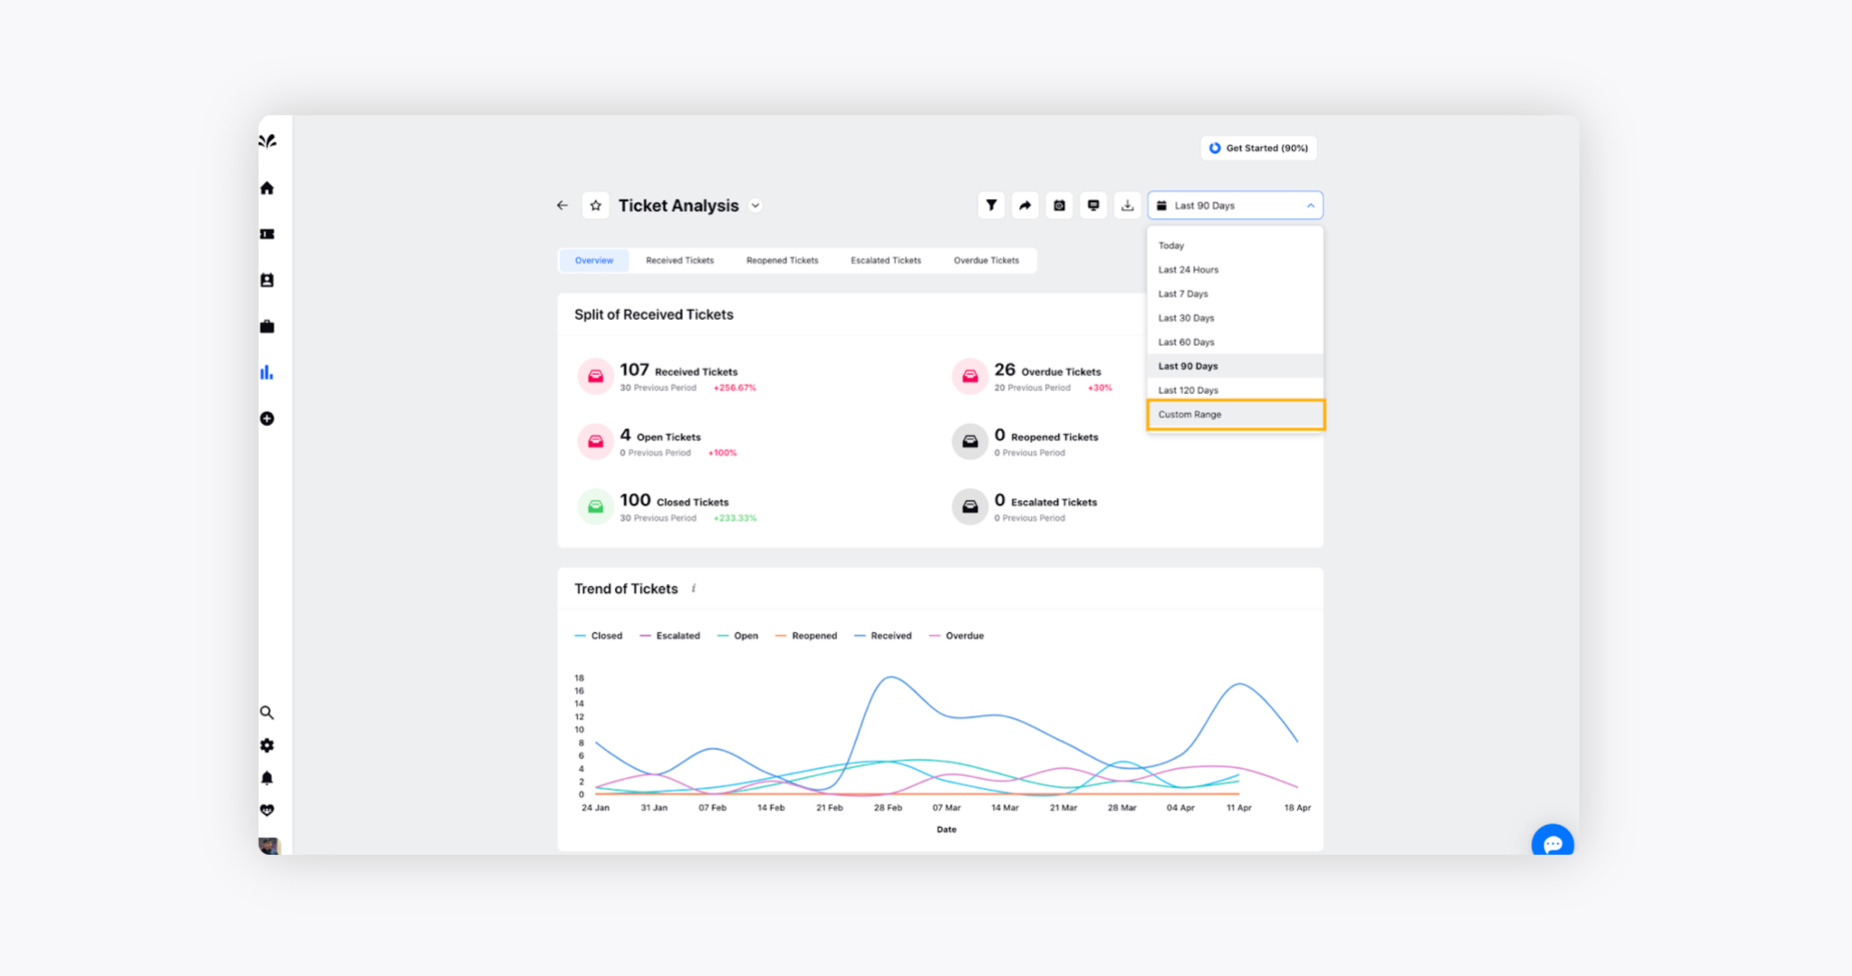
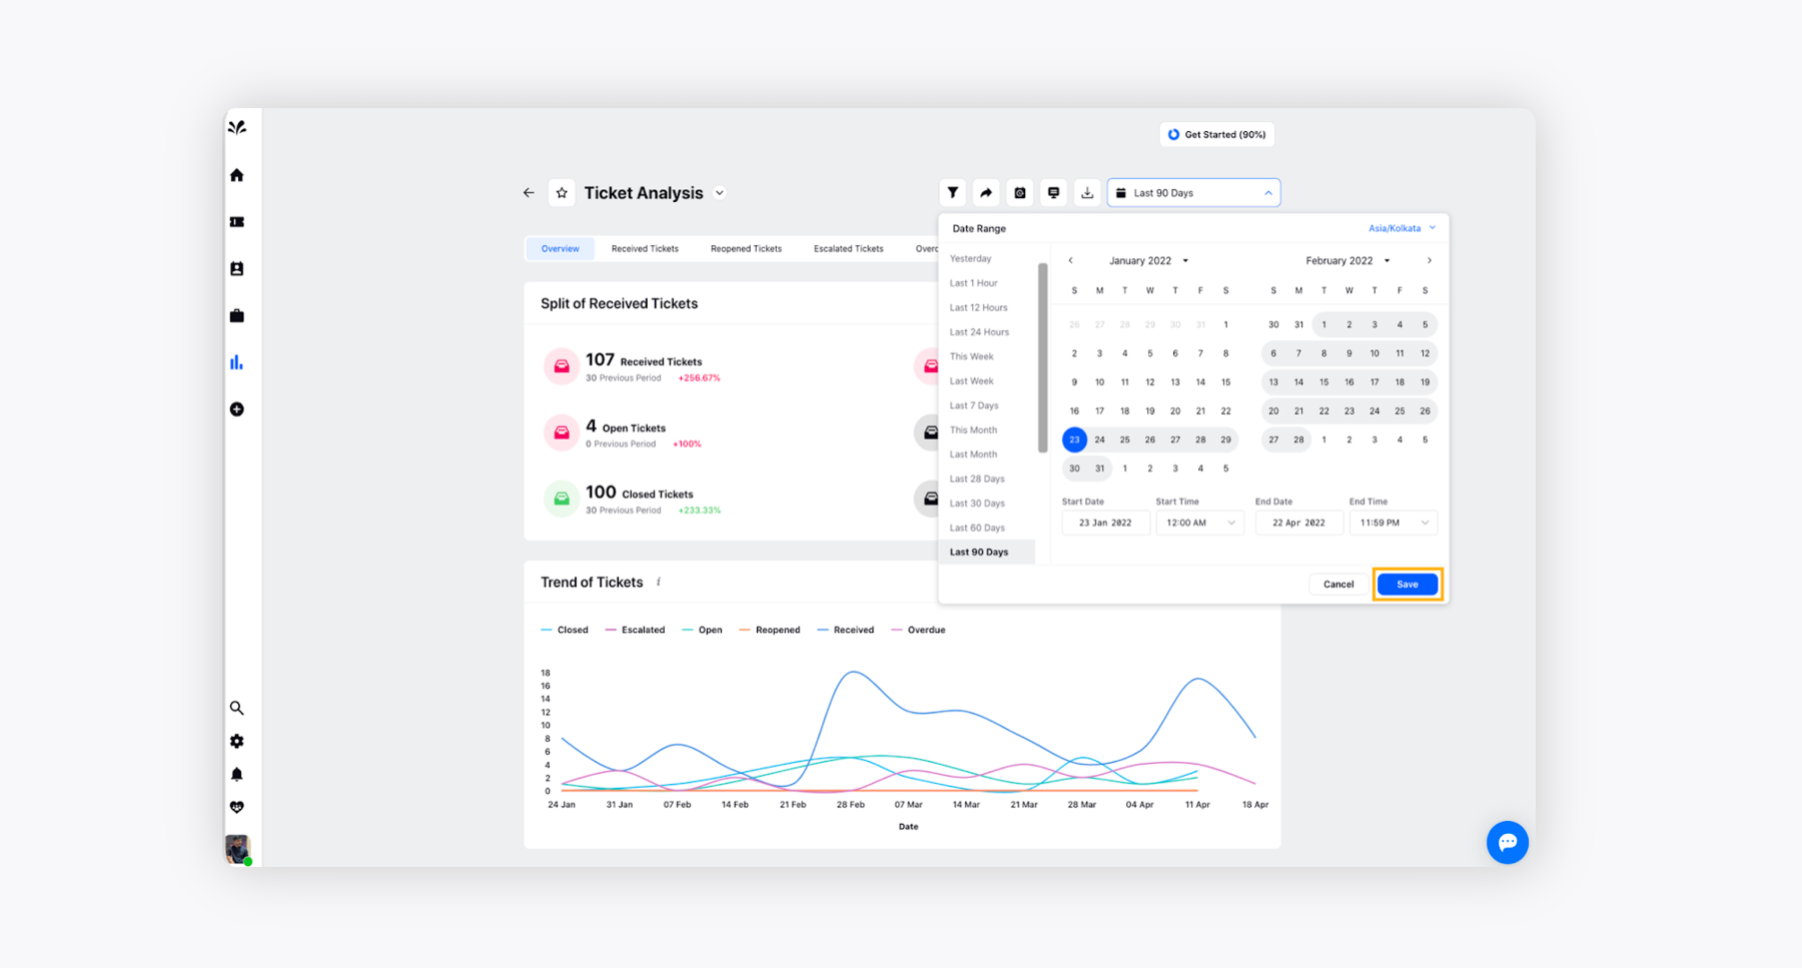
On the Date Range pop-up window, configure your reporting range and click Save in the bottom right corner. This will filter your dashboard with the range you selected. You can also select different Timezones while using Custom Range.
Drill Down Reports
Drill-down reporting helps you visualise data thoroughly and in a detailed fashion. In Sprinklr reporting, the drill-down capability is used to get a more granular overview of the data rather than a general view.
Click on any reporting widget data points to open the Third Pane on the left where you can view all the information you need.
