Use the standard Ticket Analysis dashboard in Sprinklr Service to report and visualise the overall performance of the agents and teams in terms of tickets resolved, pending, received, etc.
Ticket Analysis dashboard is a collection of widgets that provides an overall analysis of total received tickets, reopened tickets, escalated tickets, open tickets, and relevant metrics, describing trends of priority-based tickets, channel-wise received tickets, and more.
Navigate to Ticket Analysis dashboard
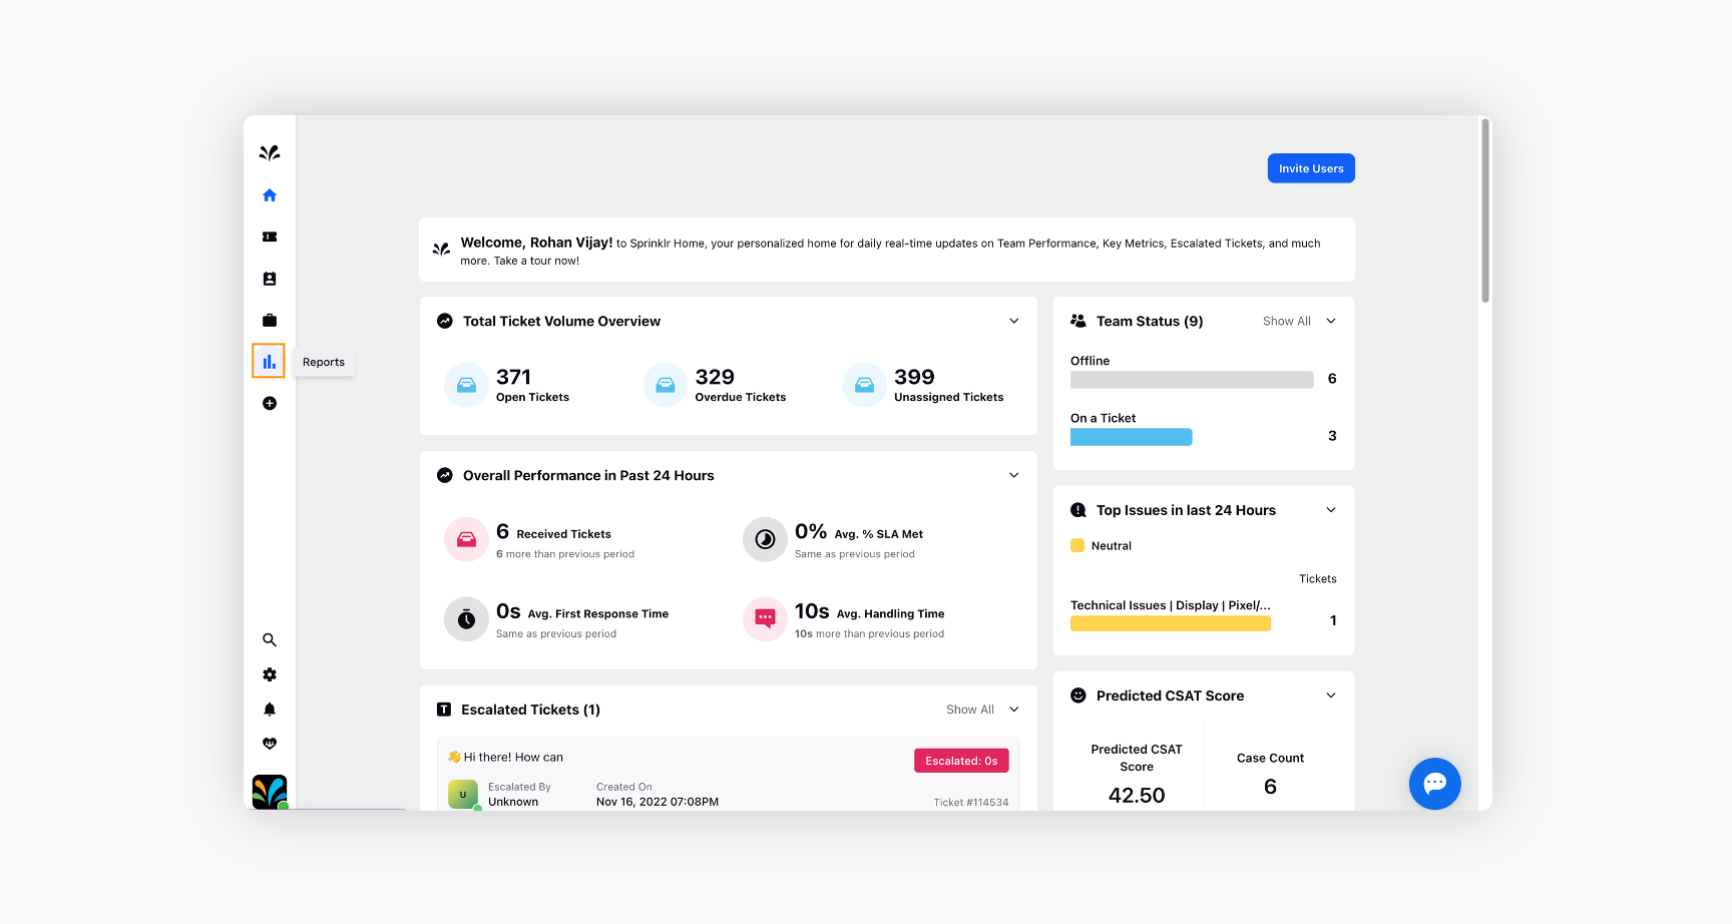
Log in to Sprinklr Service, click Reports icon on the left pane.
Search for Ticket Analysis report in the search bar of the Reporting dashboard.
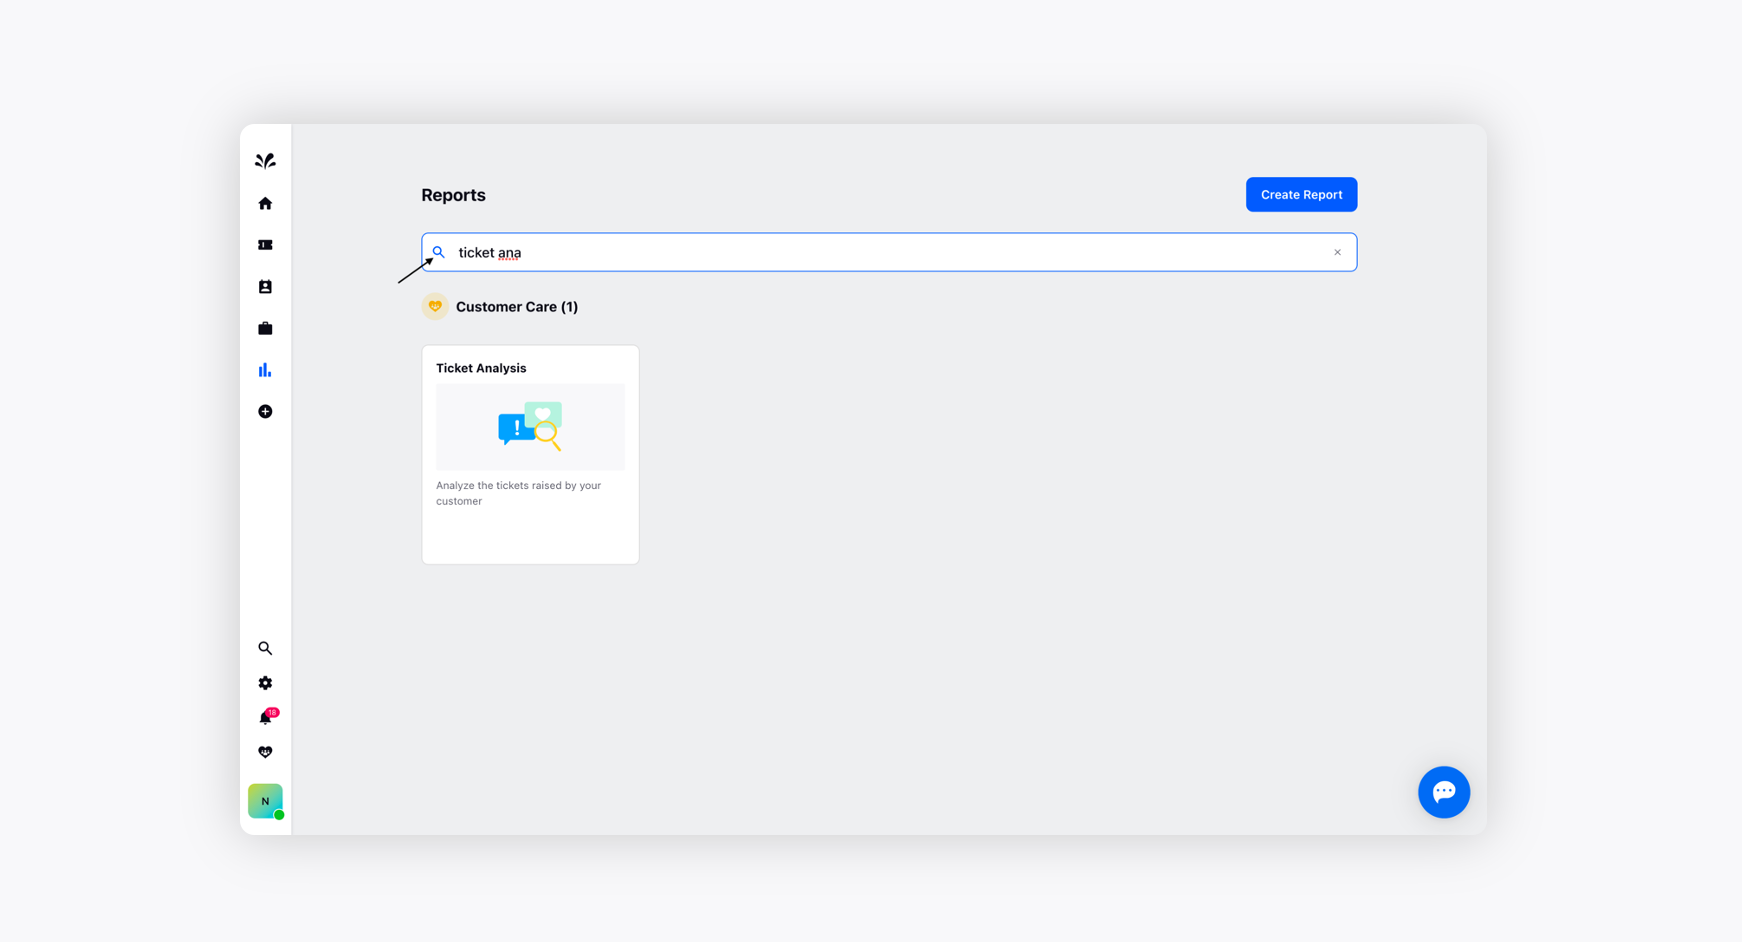
The ticket analysis report will be generated.
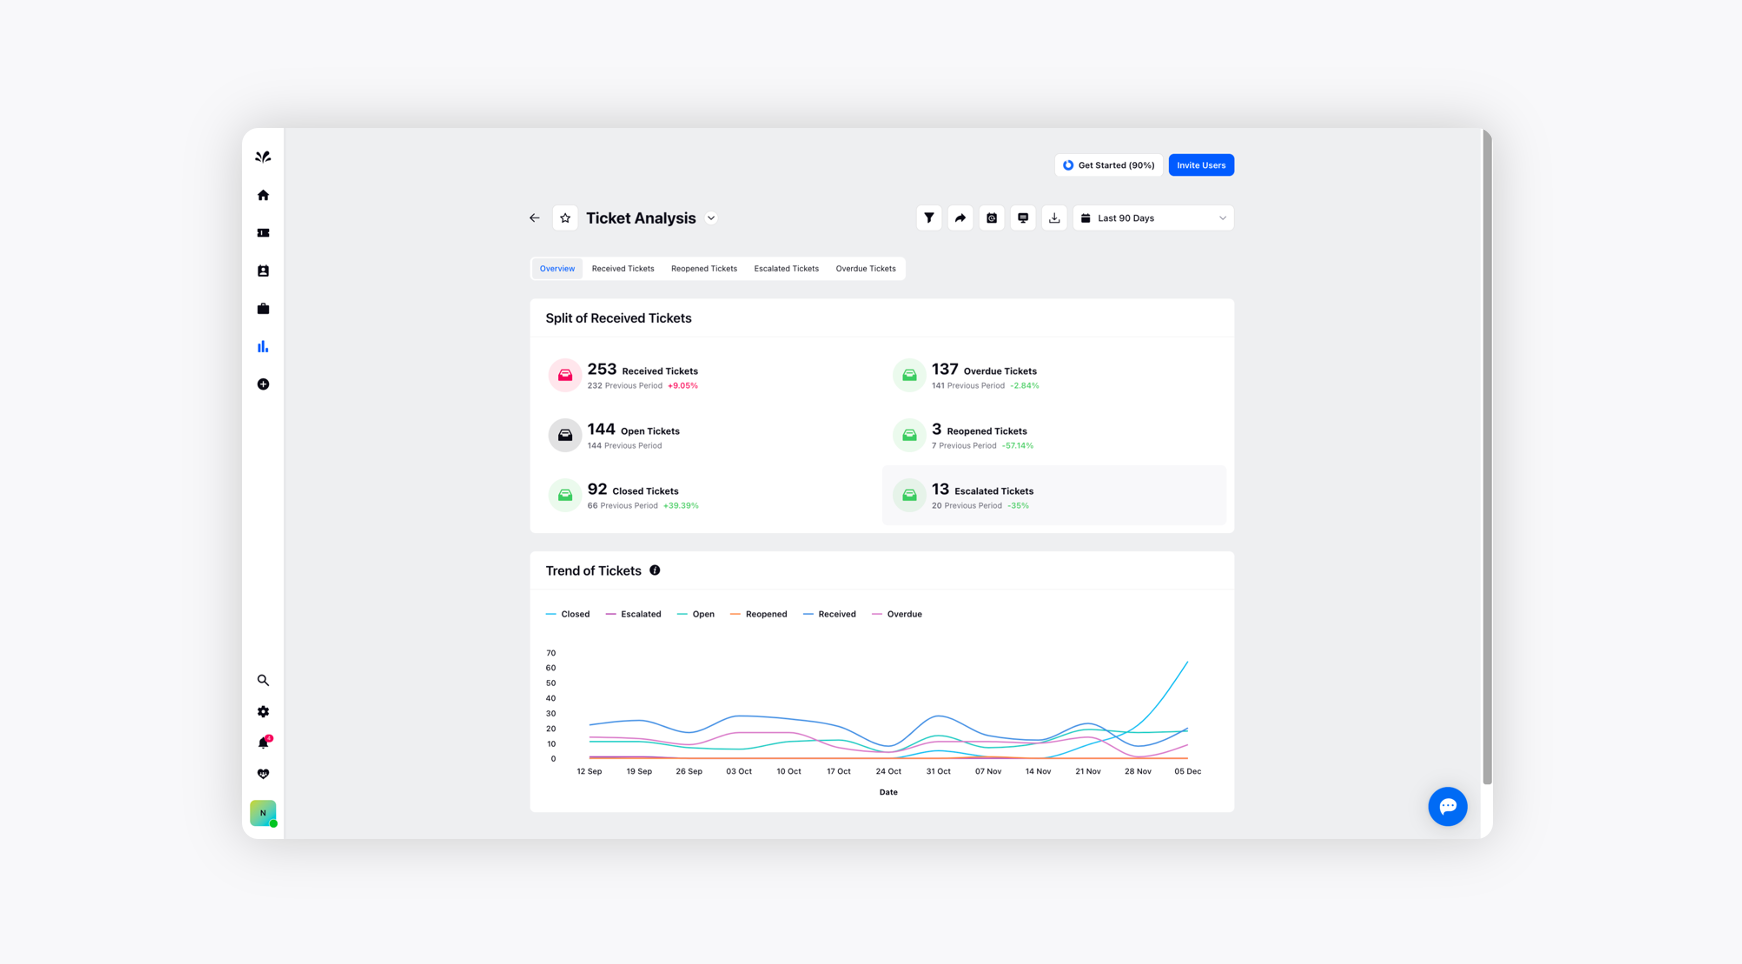
Overview of the Ticket Analysis dashboard
Ticket Analysis dashboard consists of 5 tabs, i.e., Overview, Received Tickets, Reopened Tickets, Escalated Tickets, and Overdue Tickets. Below, you can find an elaborated description for each of the widgets.
Overview
Widget Name | Description |
Split of Received Tickets | Displays the split of all the received tickets based on criteria, i.e., Received Tickets, Overdue Tickets, Open Tickets, etc.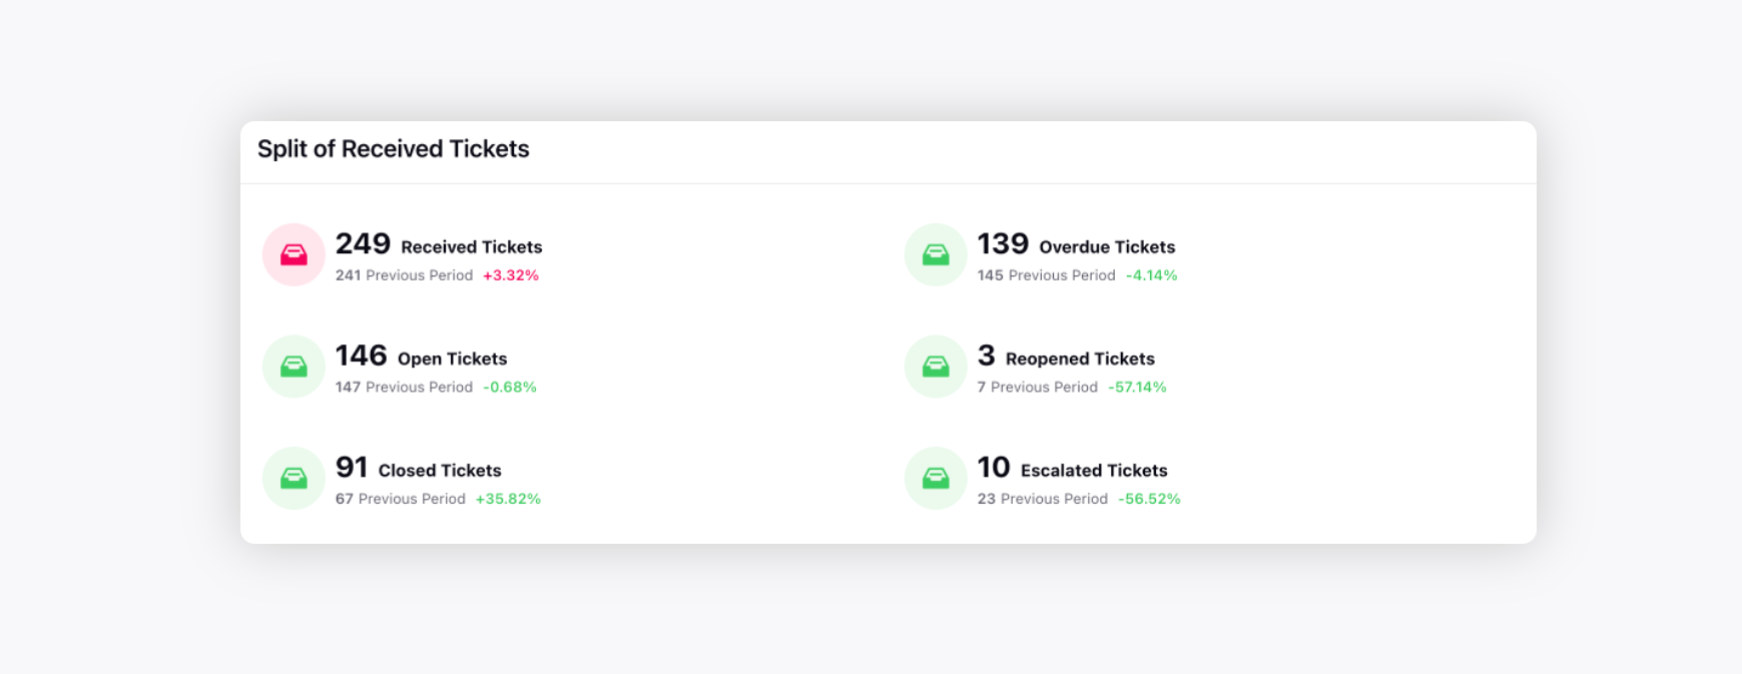 |
Trend of Tickets | Displays the trend of ticket over a period of time.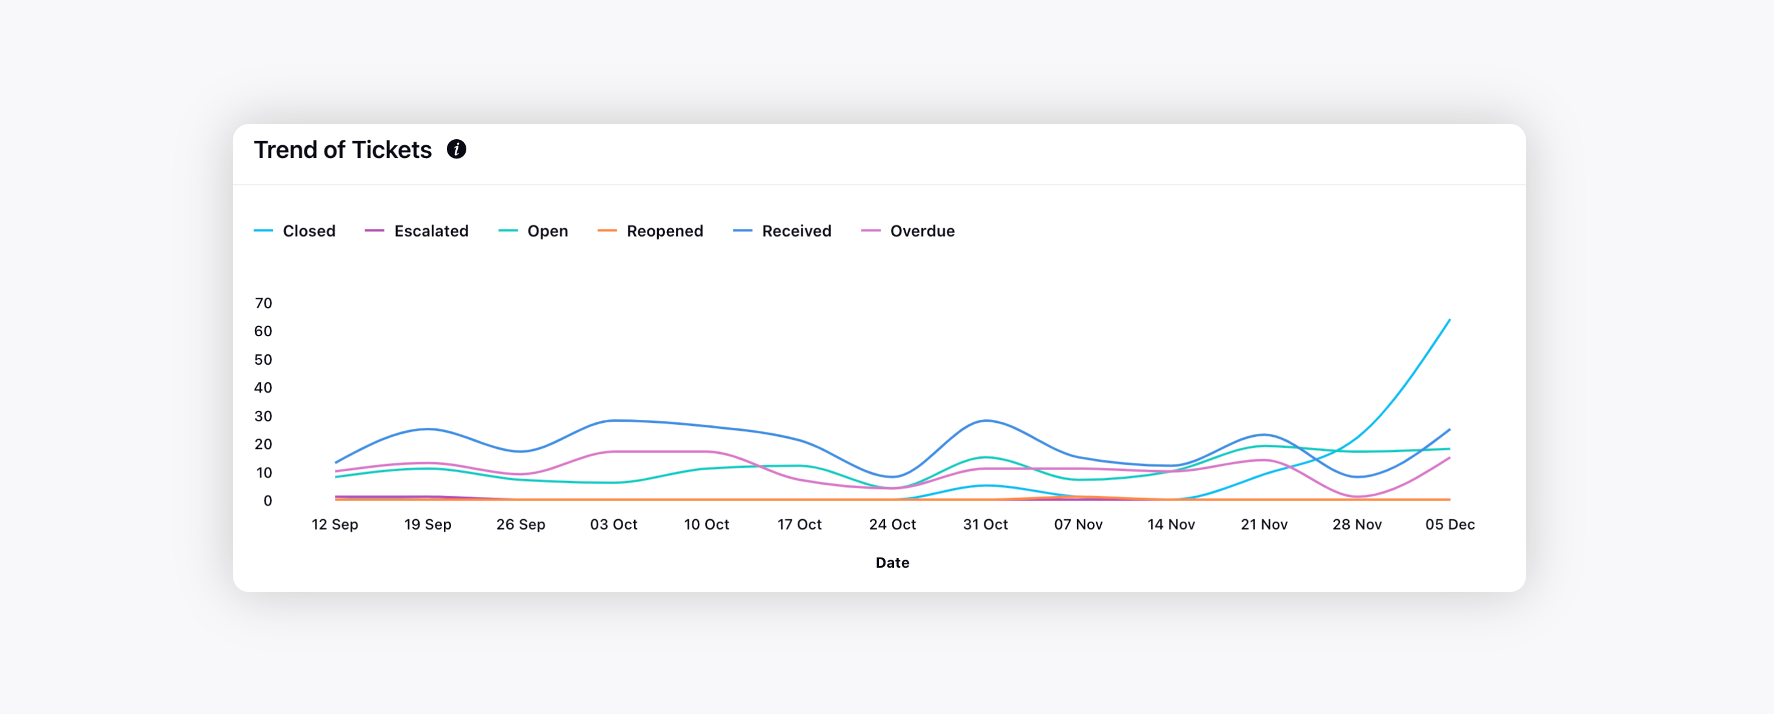 |
Received Tickets
Widget Name | Description |
Trend of Received Tickets | Displays the trend of the overall received tickets over time.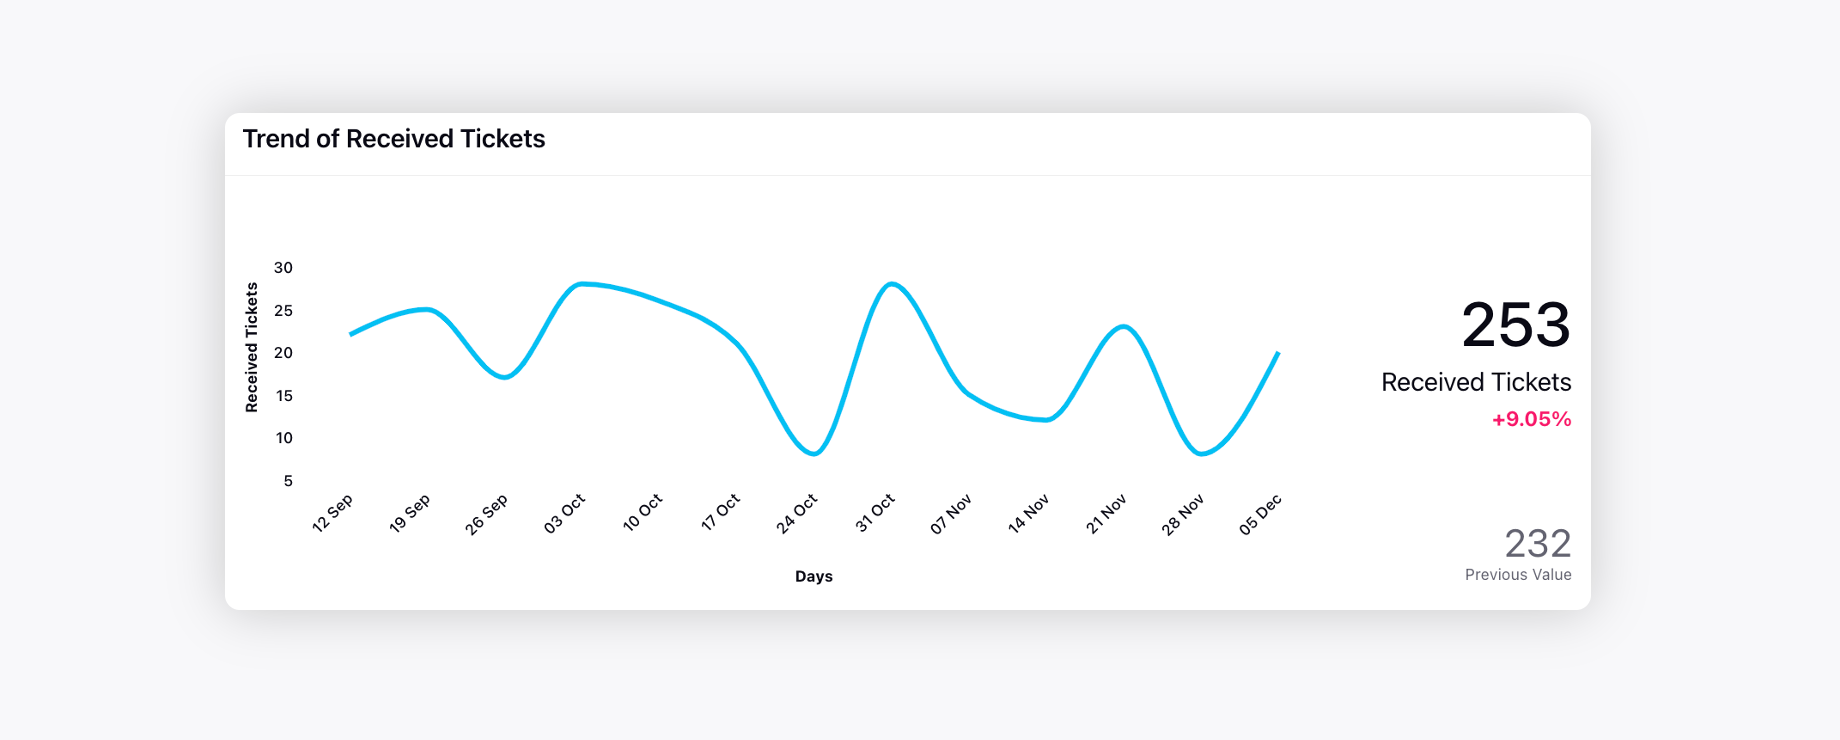 |
Day of the Week we receive the Most Tickets | Displays the trend of received tickets and the closed tickets for each day of the week.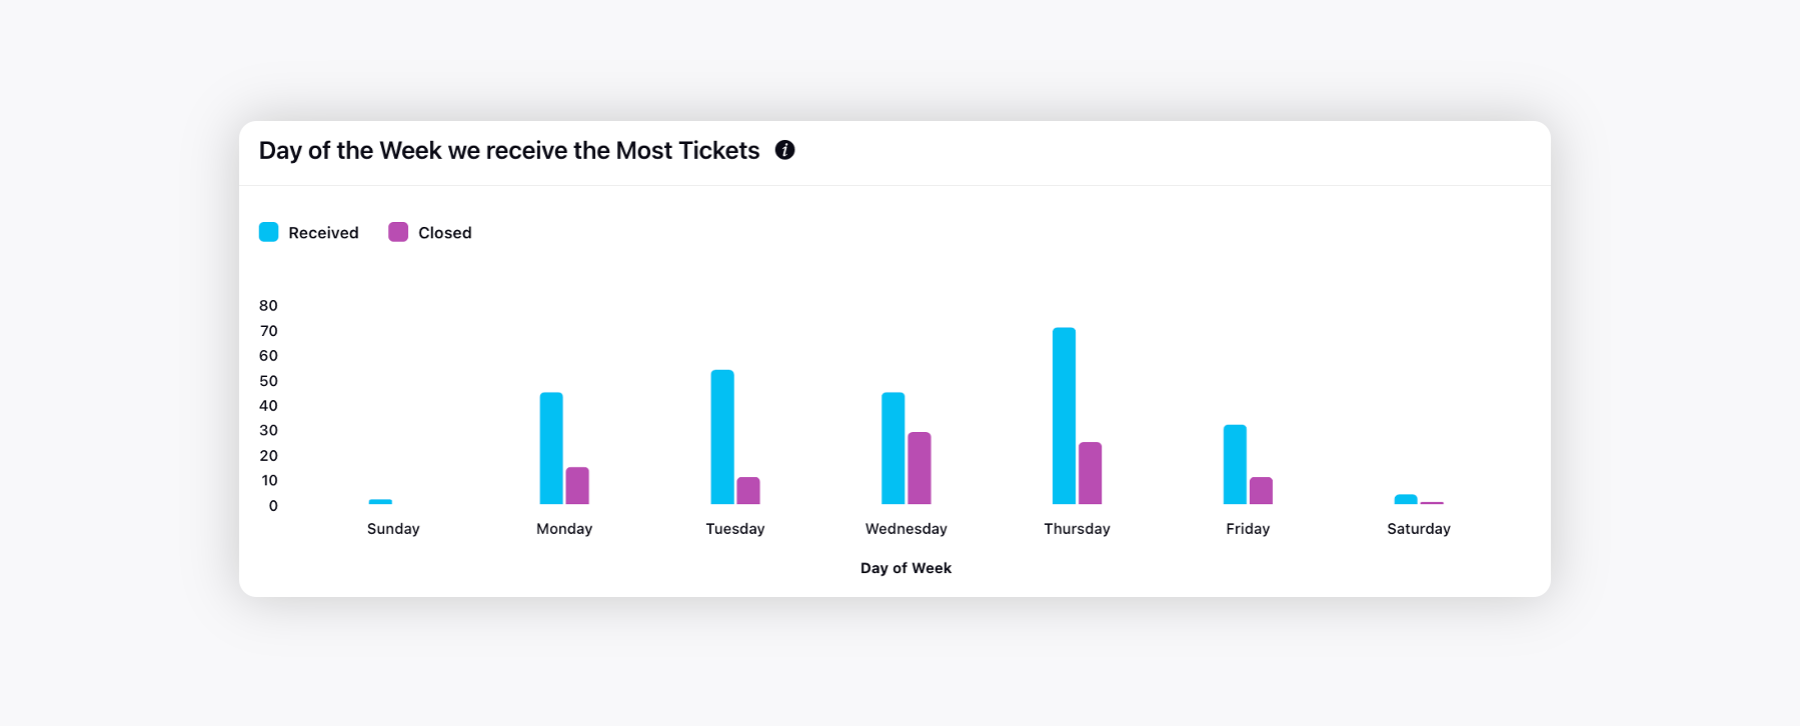 |
Time of the Day we receive the Most Tickets | Displays the trend of daily received tickets on an hourly basis.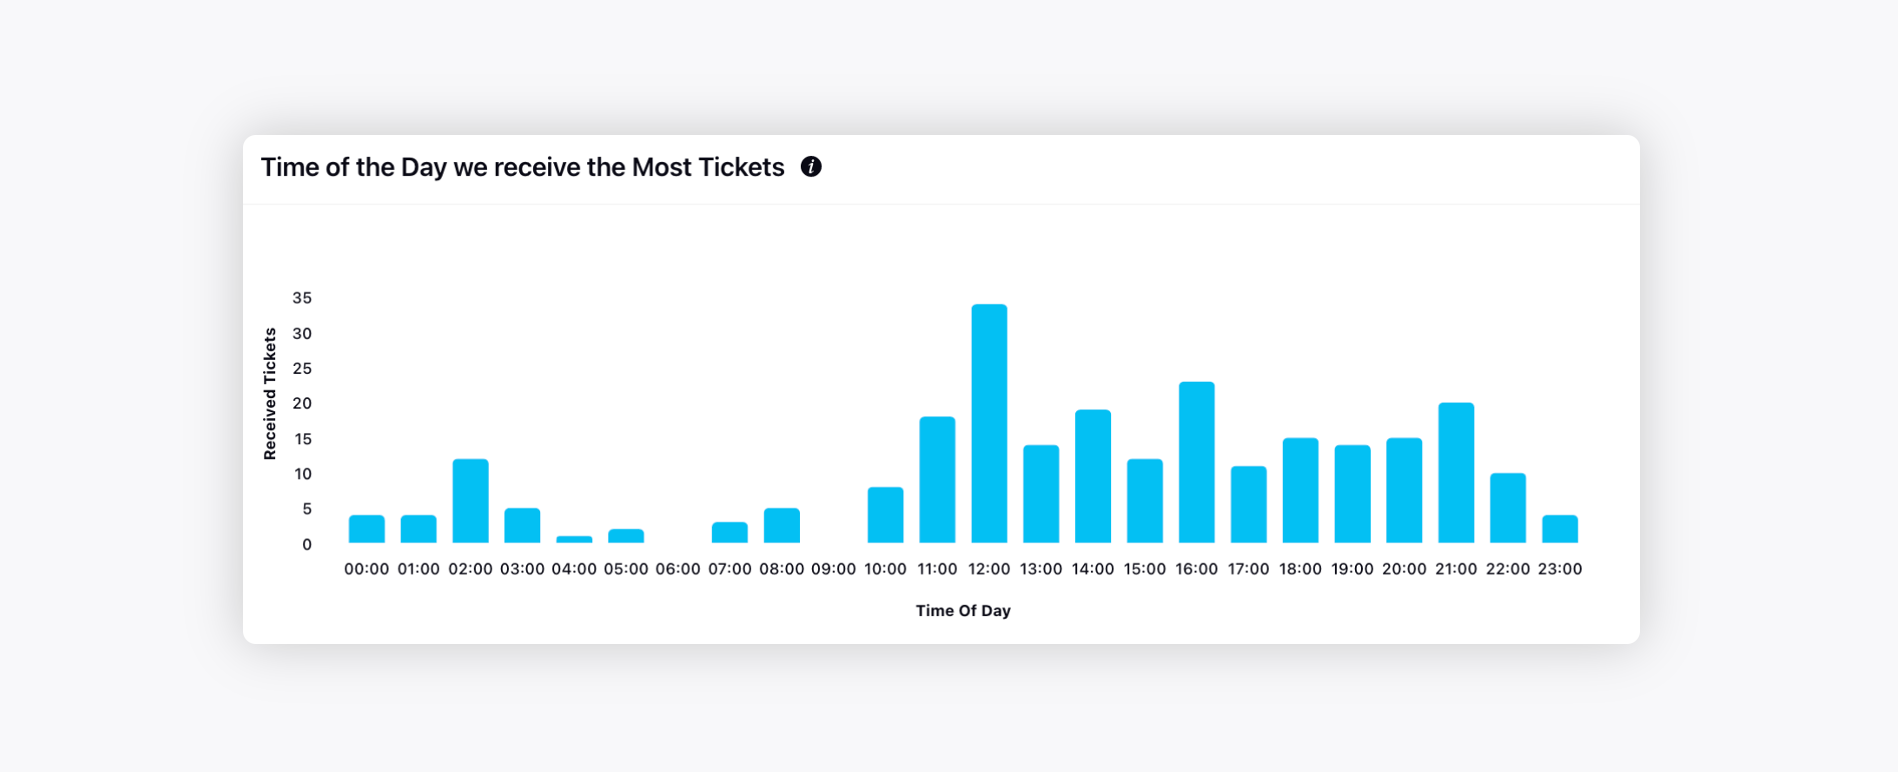 |
Issue wise split of Received Tickets | Displays an issue-wise split of the received tickets to help understand which issues contribute to the maximum and minimum tickets. This split automatically occurs through the Sprinklr AI model without any manual intervention.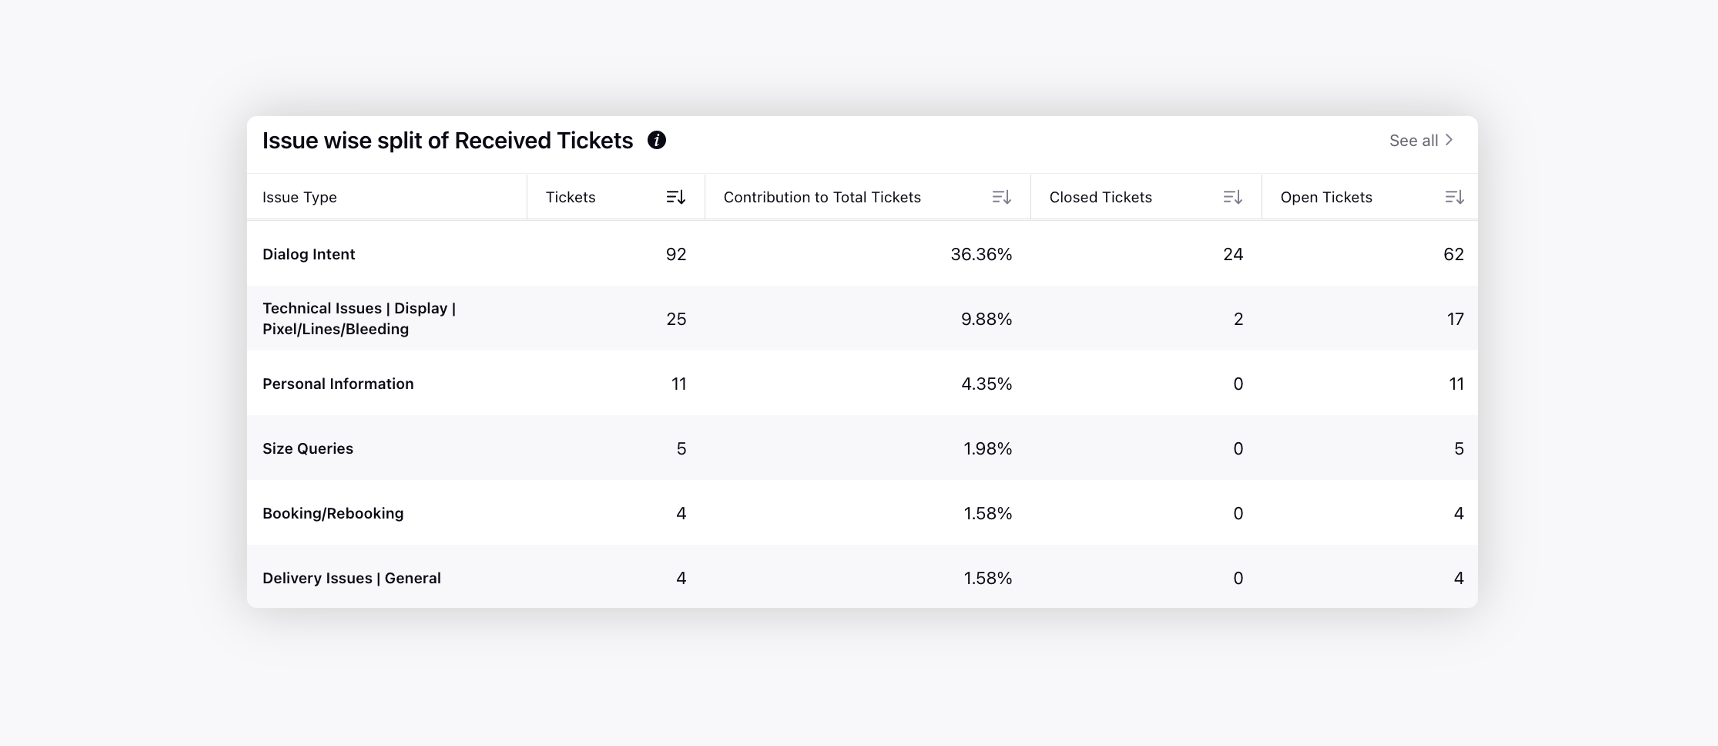 |
Tickets Received by Priority | Displays the priority-wise split of the received tickets to help understand which priority contributes the maximum % of tickets.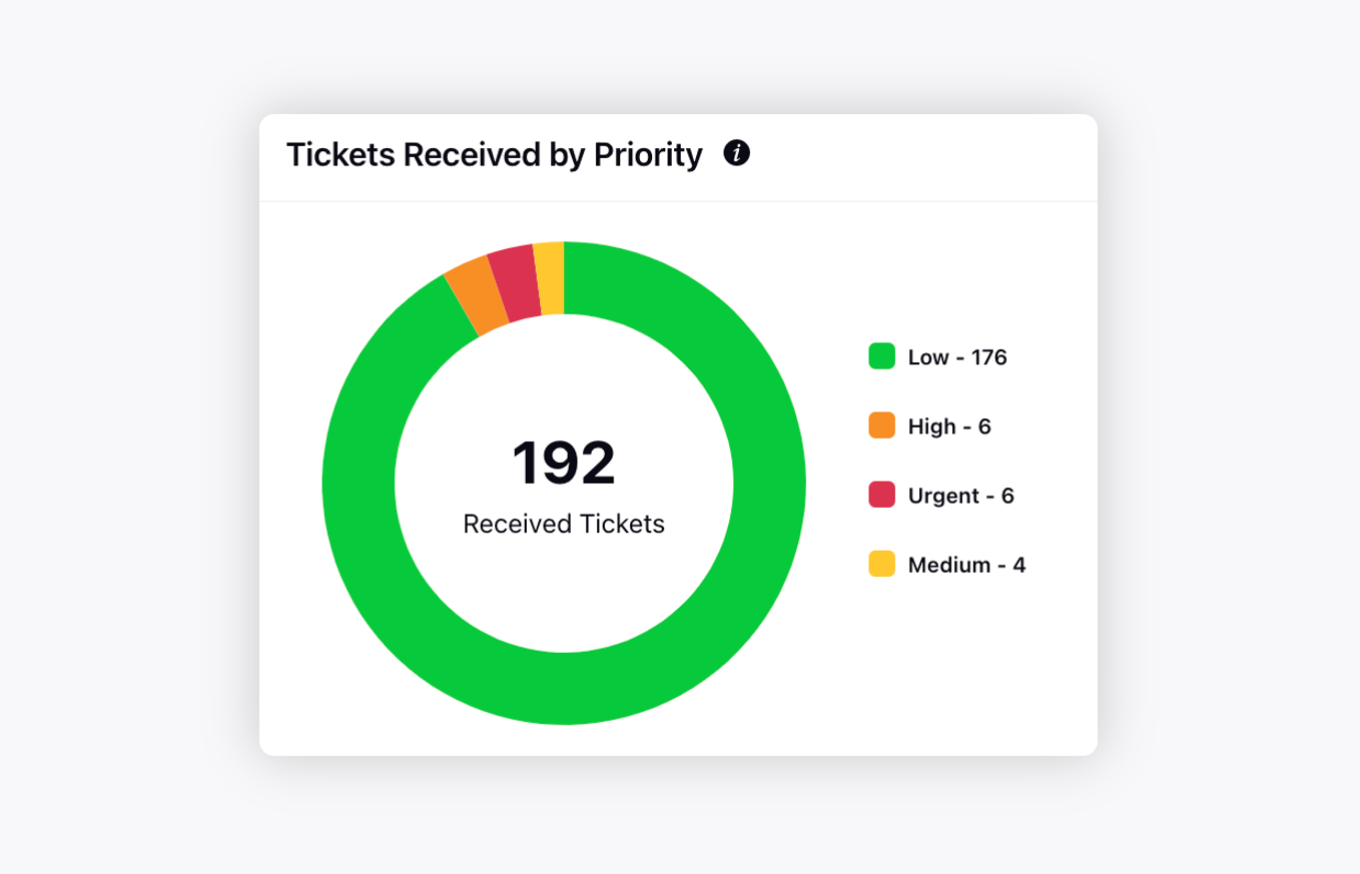 |
Priority wise split of Open and Closed Tickets | Displays the priority-wise split of the received tickets to help understand which priority contributes to what percentage of tickets.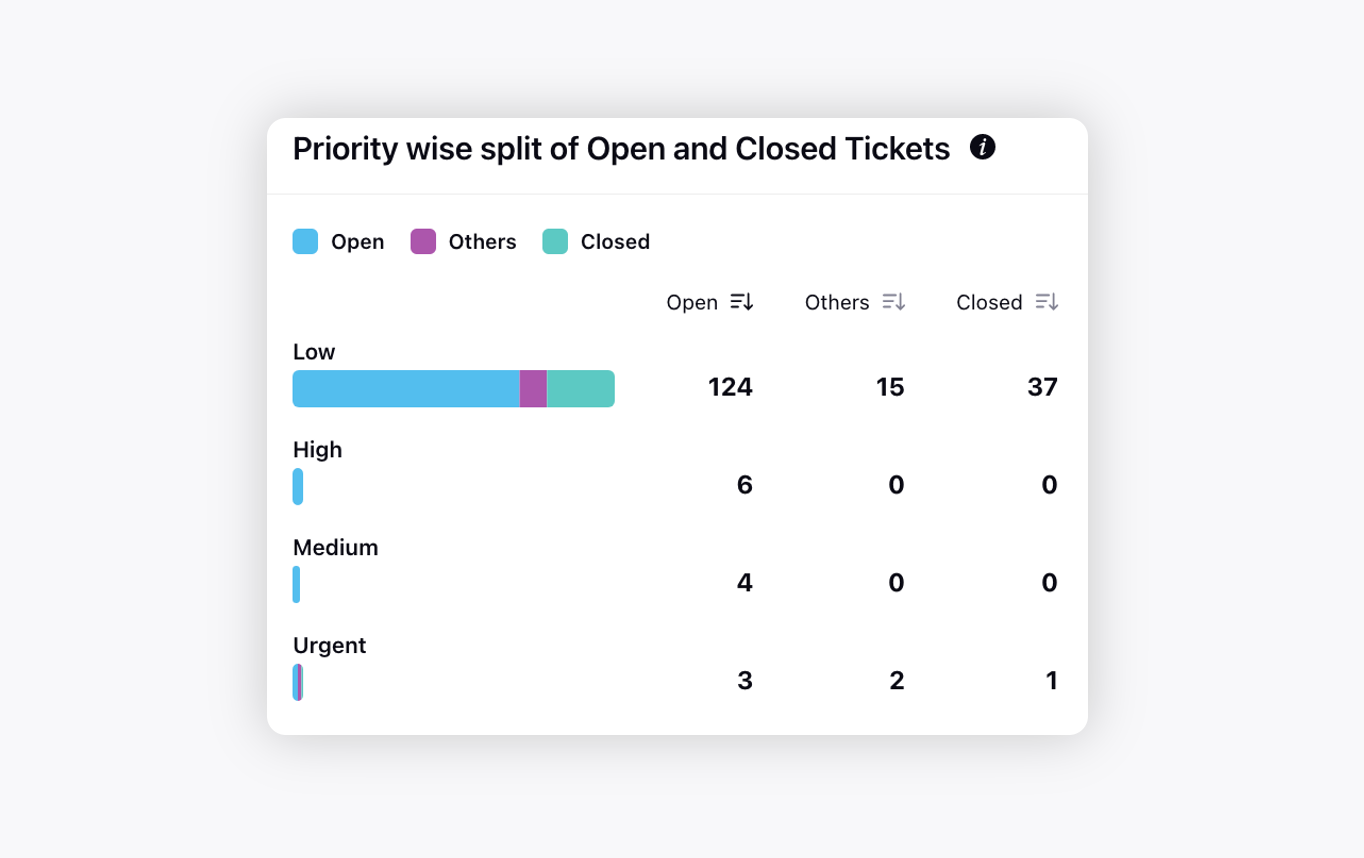 |
Platform wise split of Open and Closed Tickets | Displays the platform-wise split of the received tickets to help understand the overall percentage contribution of each platform.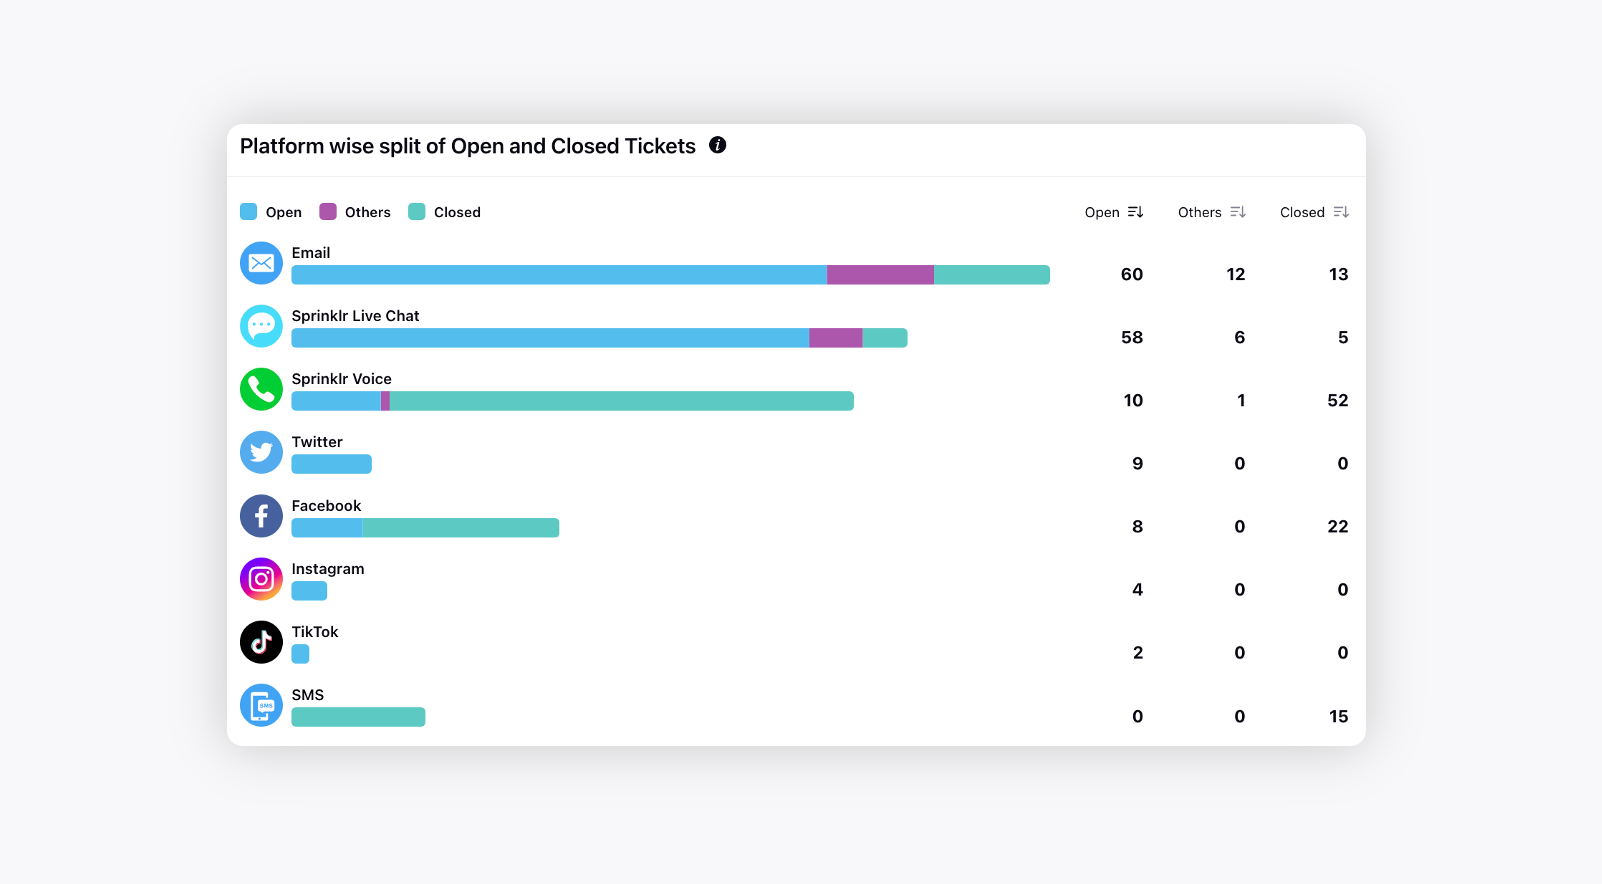 |
Tickets Received by Teams | Displays which team receives the most tickets to help plan your resources better.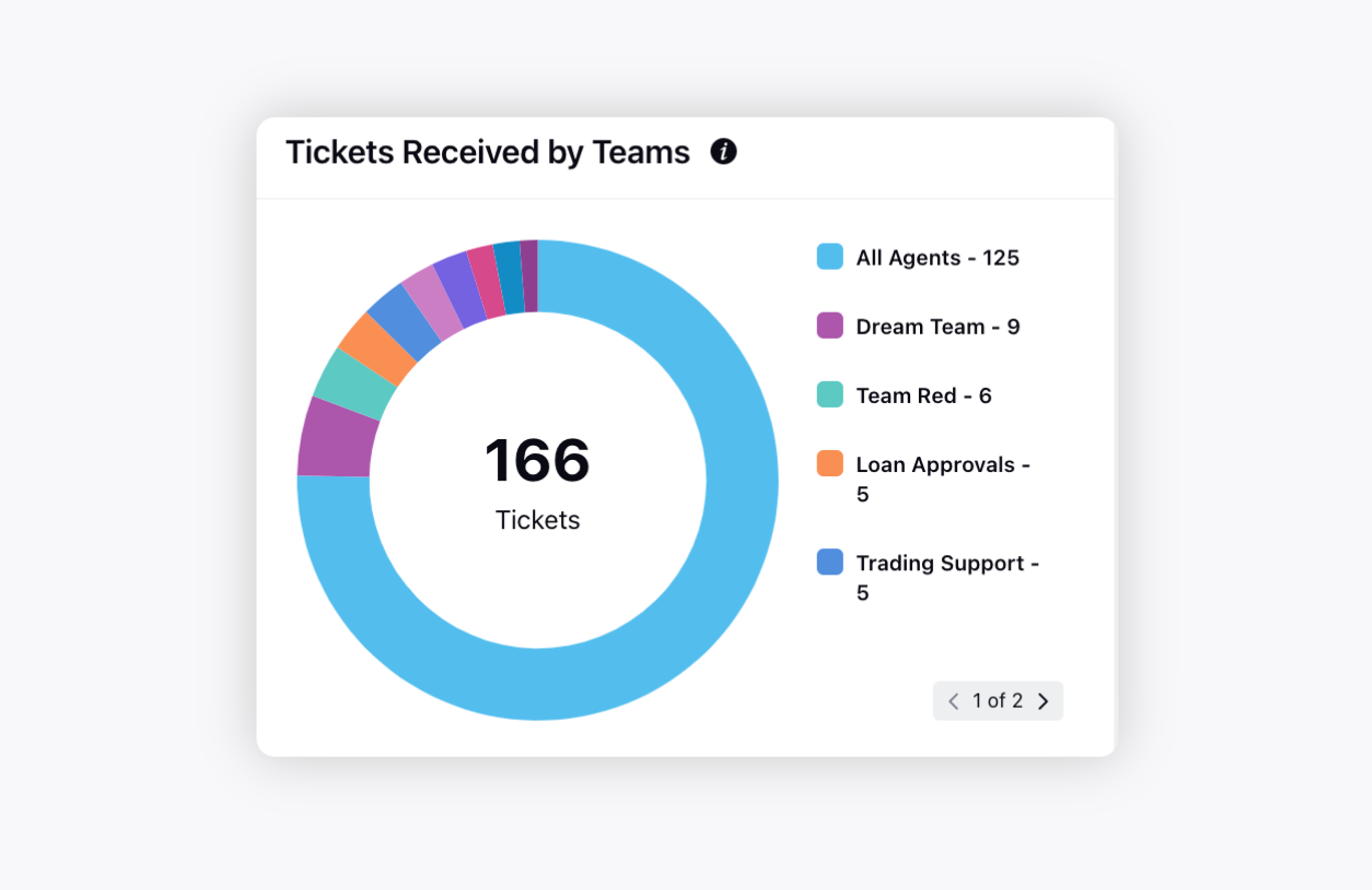 |
Team wise split of Open and Closed Tickets | Displays the efficiency of each team by tracking the open and closed tickets out of the received tickets.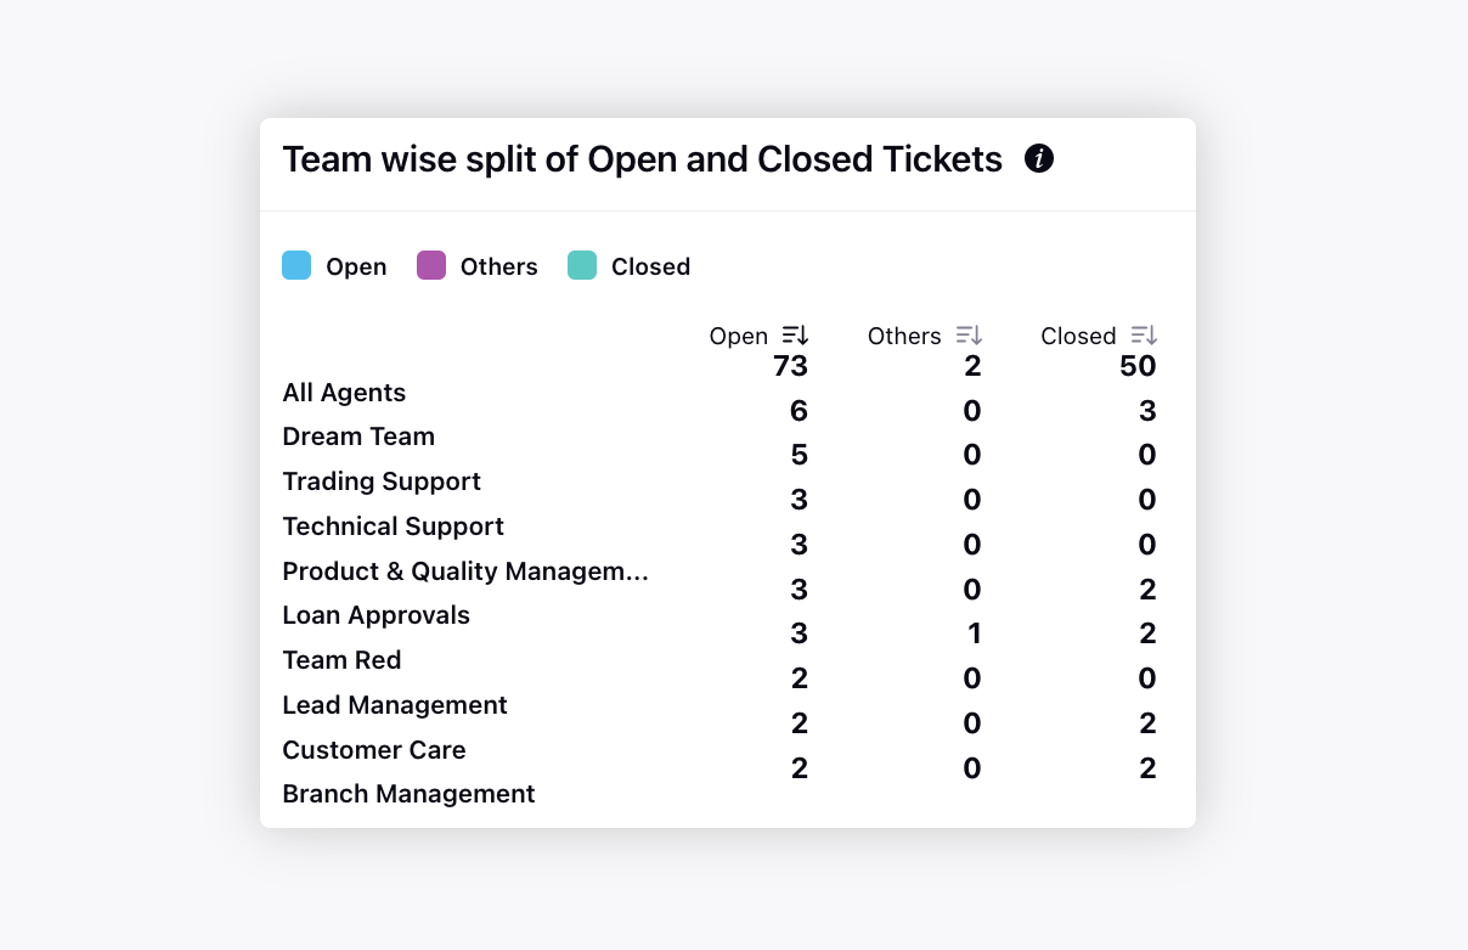 |
Agent wise split of Tickets | Displays the number of tickets received by each agent and the number of tickets they resolved out of the received ones.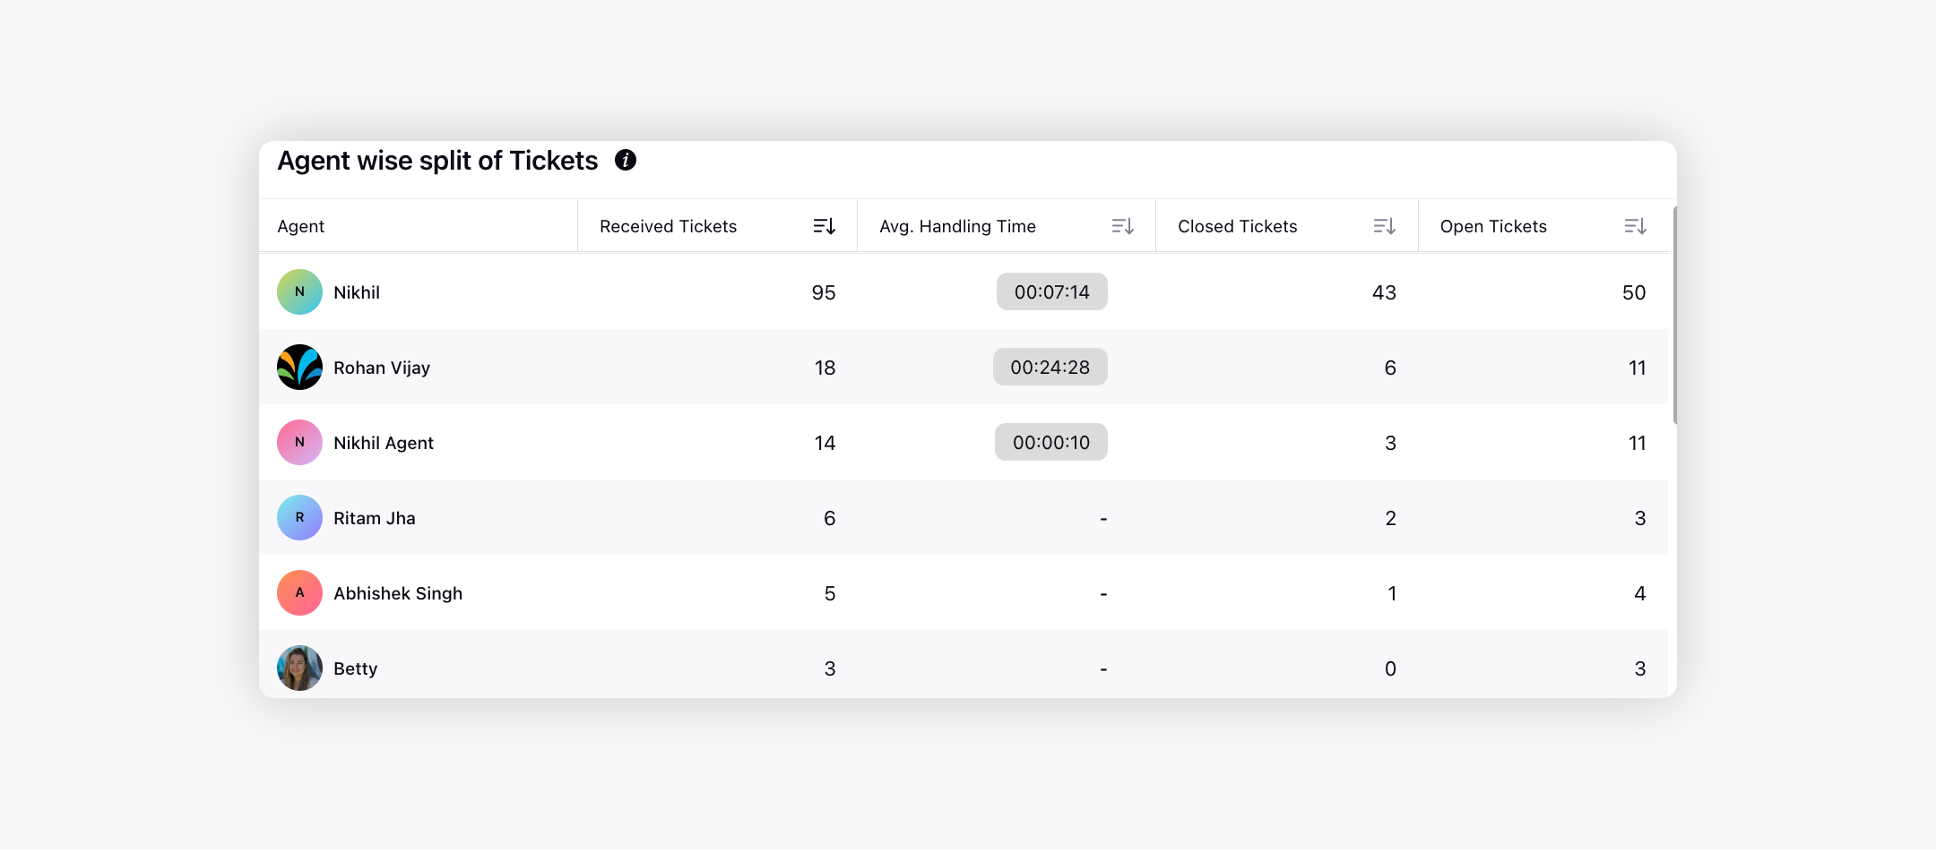 |
Reopened Tickets
Widget Name | Description |
Trend of Reopened Tickets | Displays the trend of the reopened tickets over time.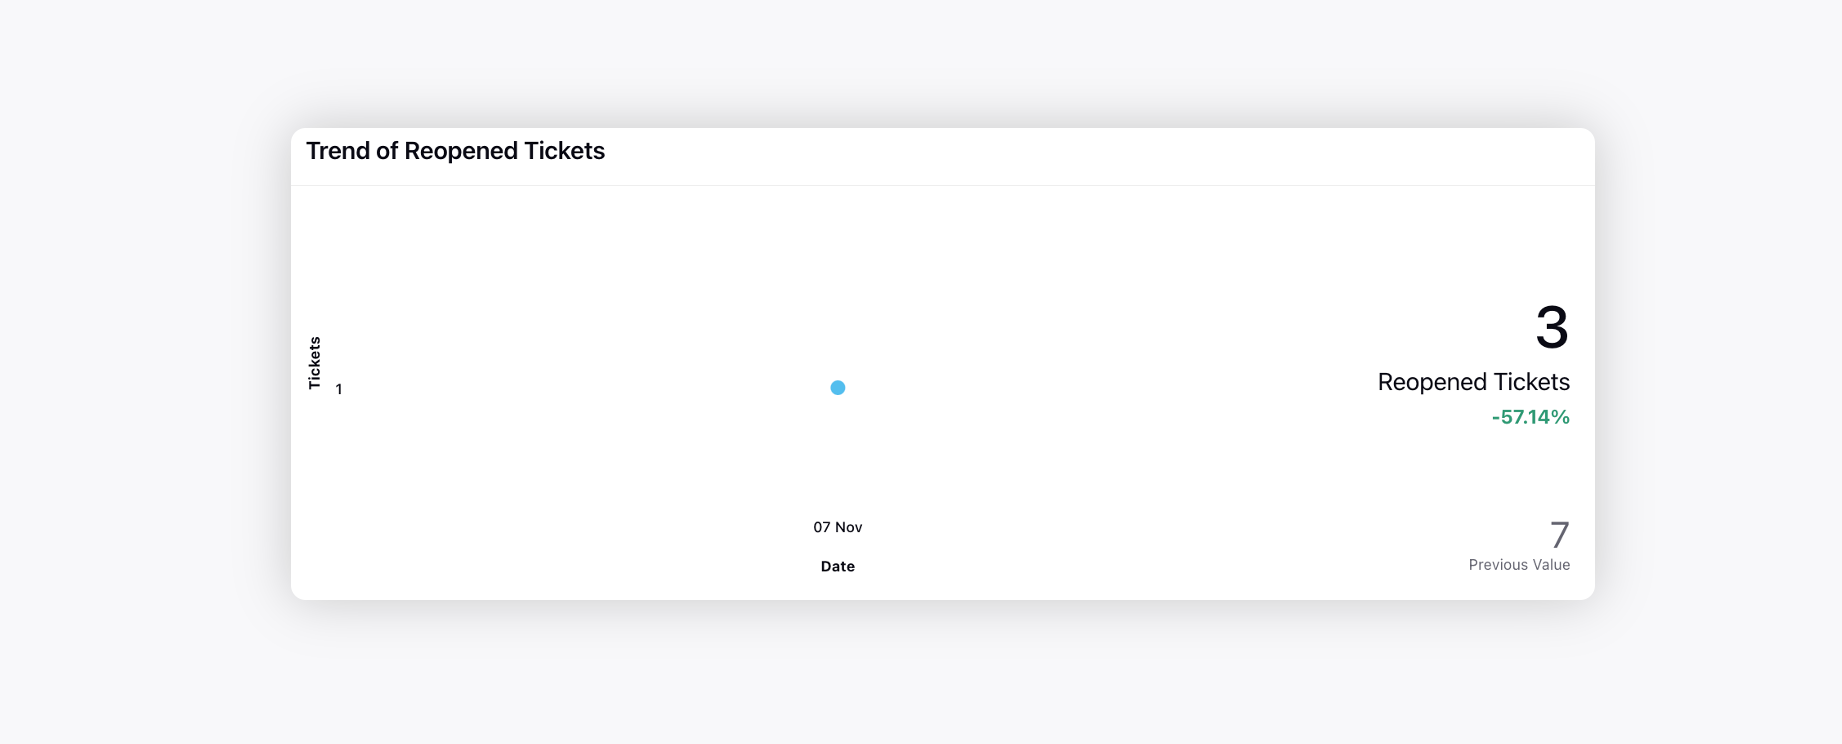 |
Issue wise split of Reopened Tickets | Displays the number and percentage of tickets reopened for each issue.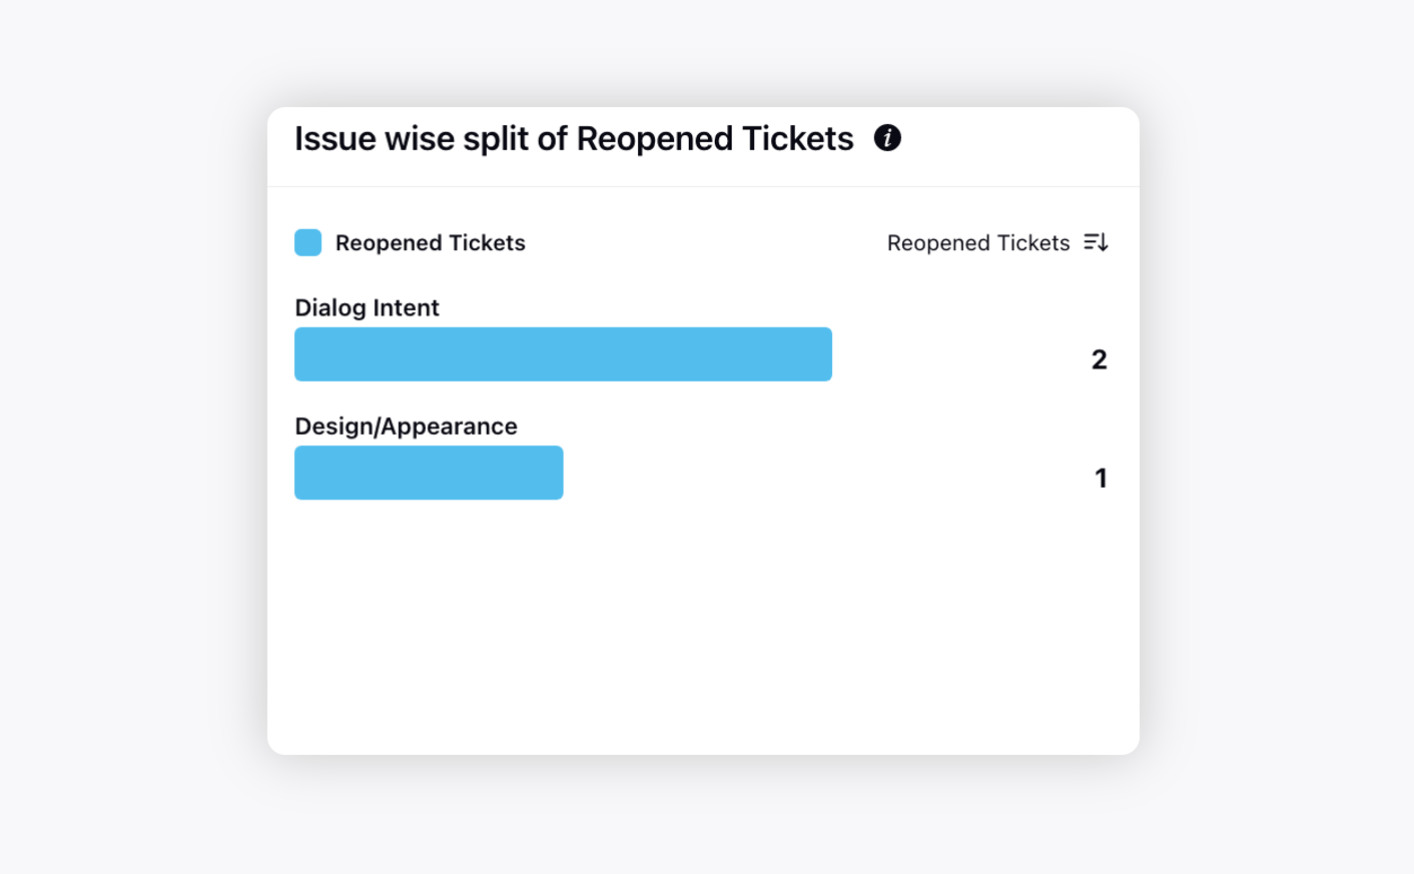 |
Platform wise split of Reopened Tickets | Displays which platform contributes the maximum percentage of reopened tickets.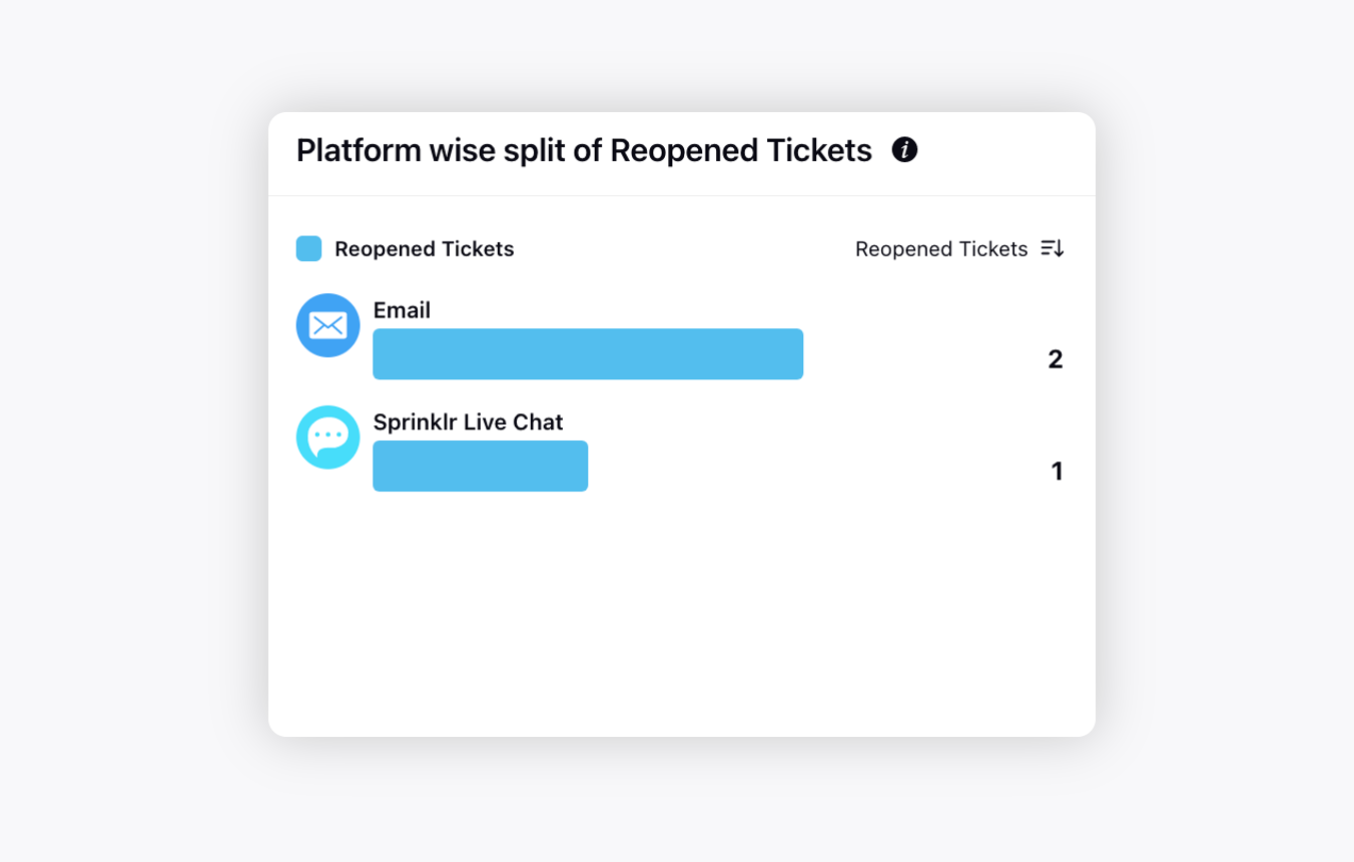 |
Priority wise split of Reopened Tickets | Displays which priority contributes to what percentage of reopened tickets.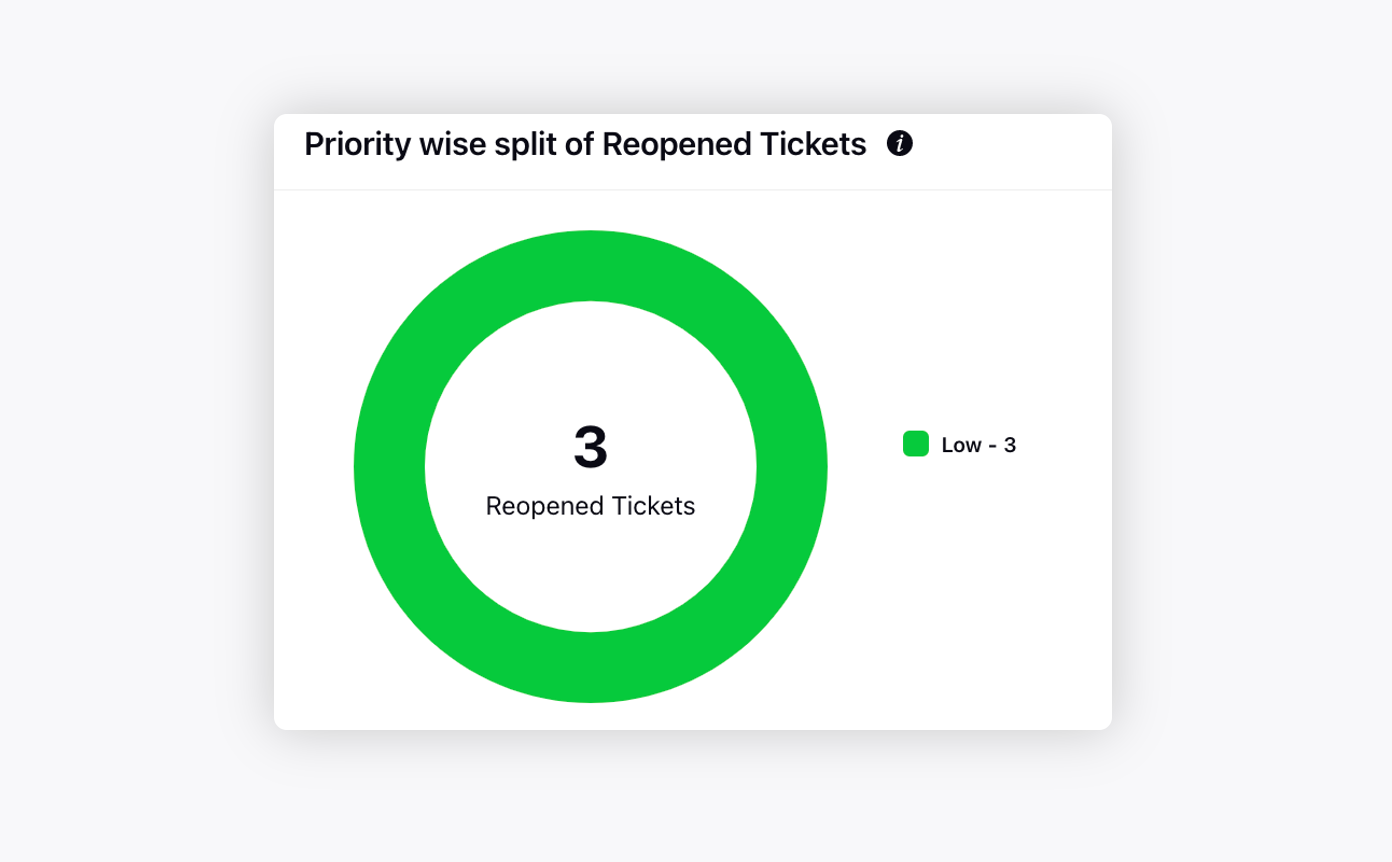 |
Team wise split of Reopened Tickets | Displays which team tickets are reopened most and least out of the closed tickets.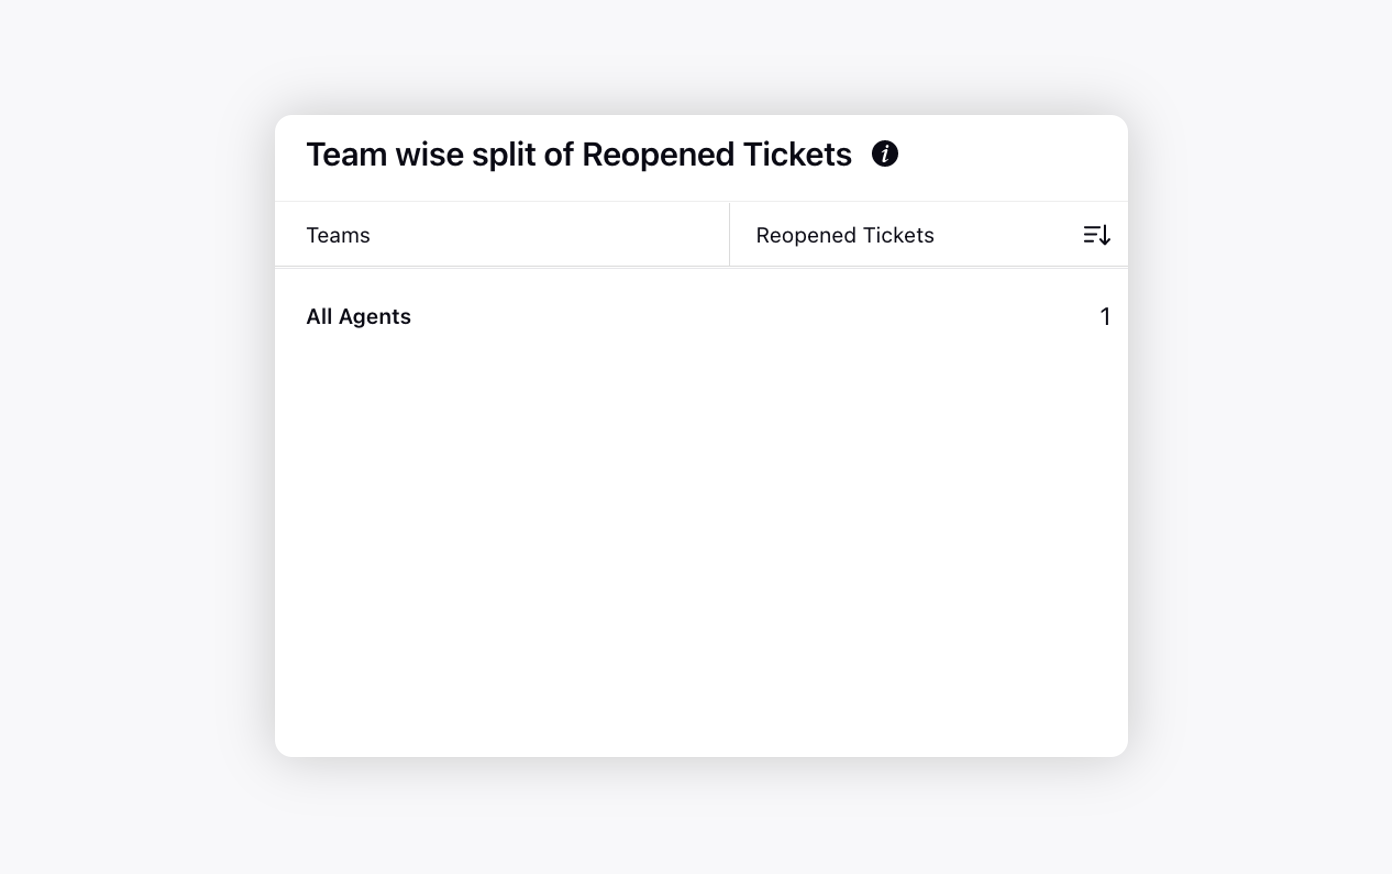 |
Agent wise split of Reopened Tickets | Displays which agent tickets are reopened most and least out of their closed tickets.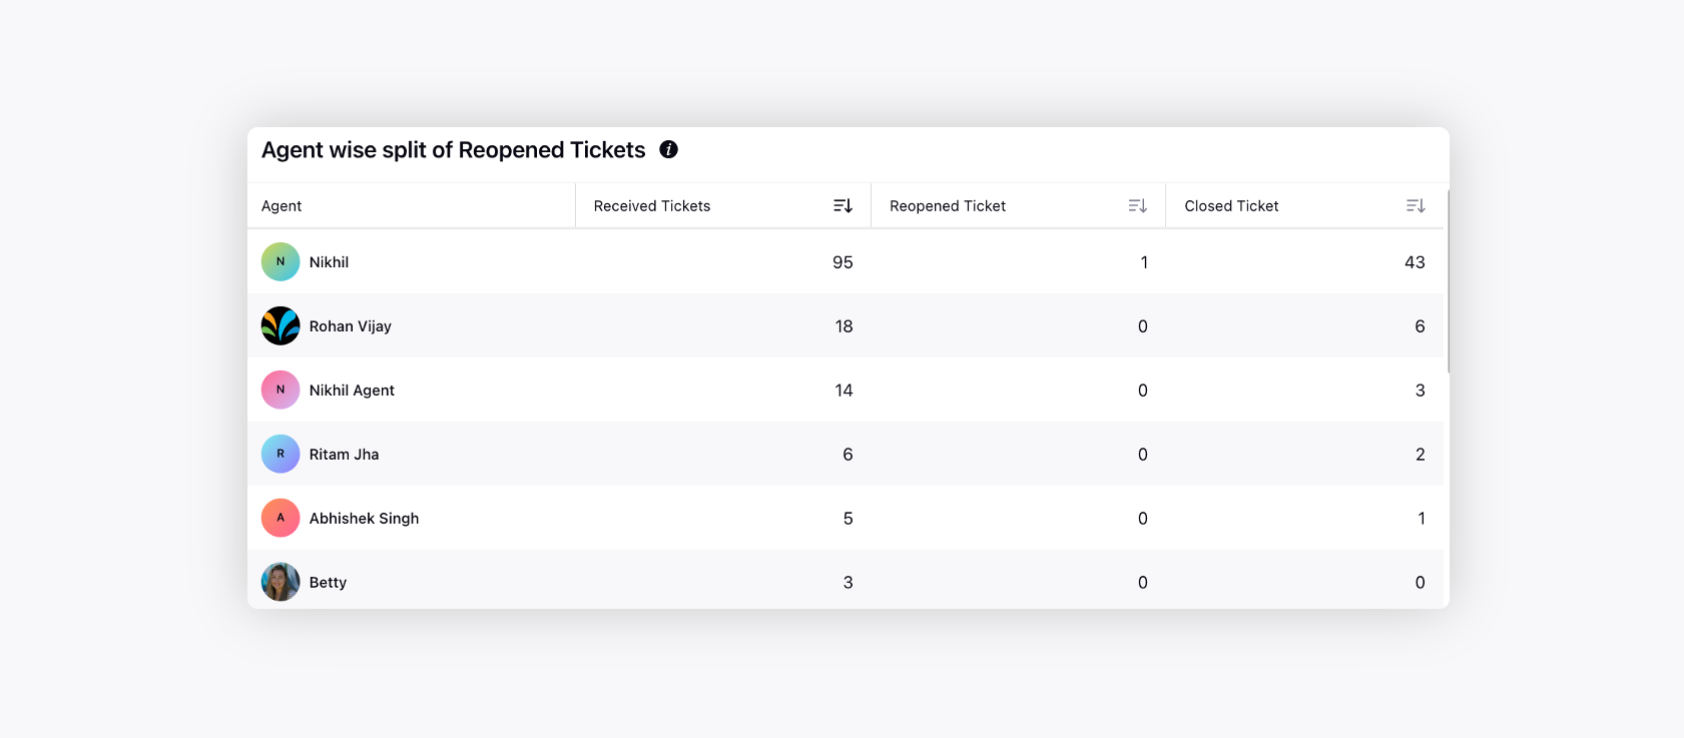 |
Escalated Tickets
Widget Name | Description |
Trend of Escalated Tickets | Displays the trend of the escalated tickets over time.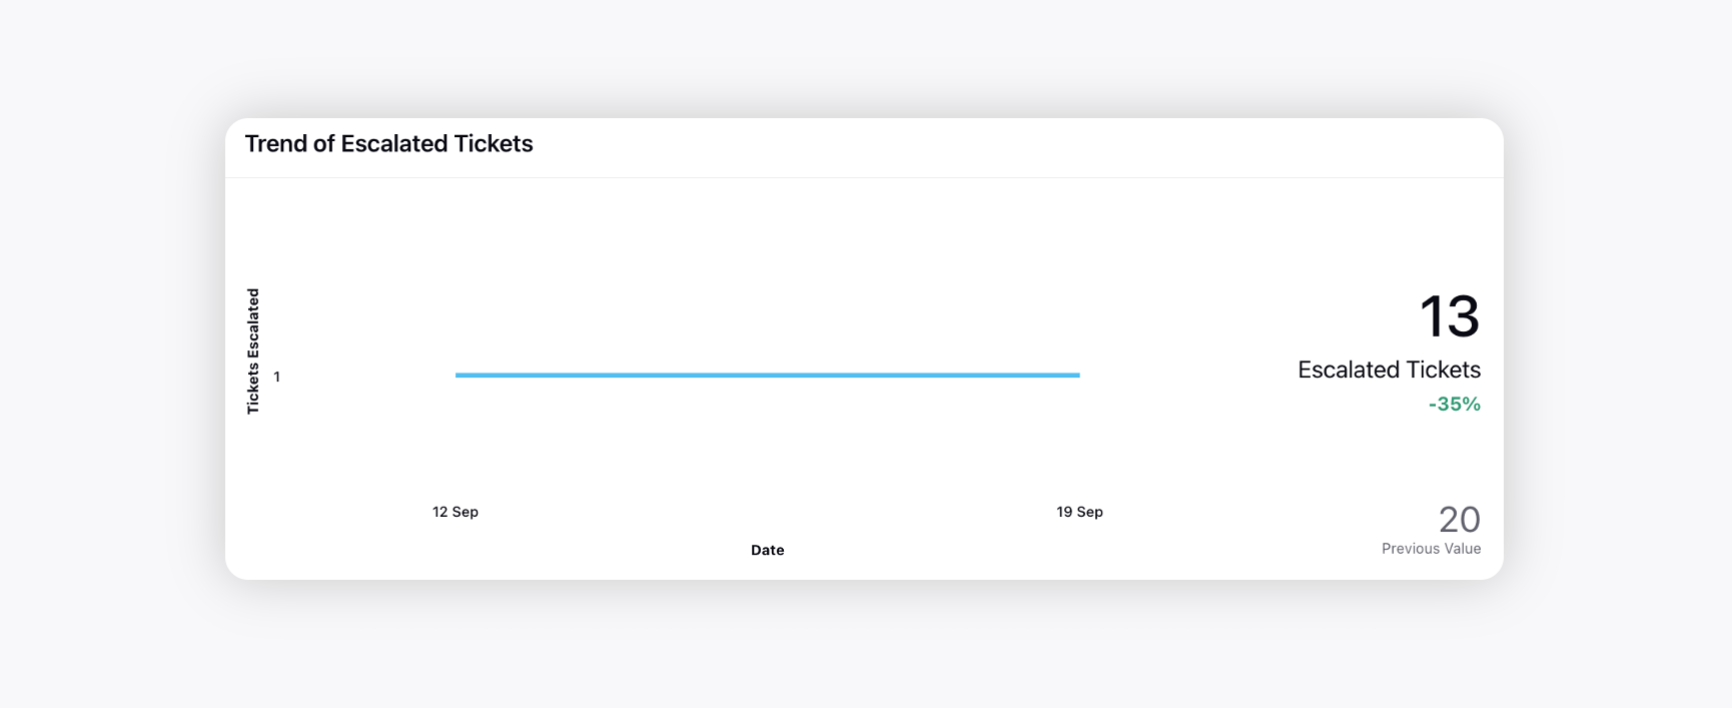 |
Average Ageing of Escalated Tickets | Displays how many tickets are escalated for how much time to understand the spread of escalated tickets.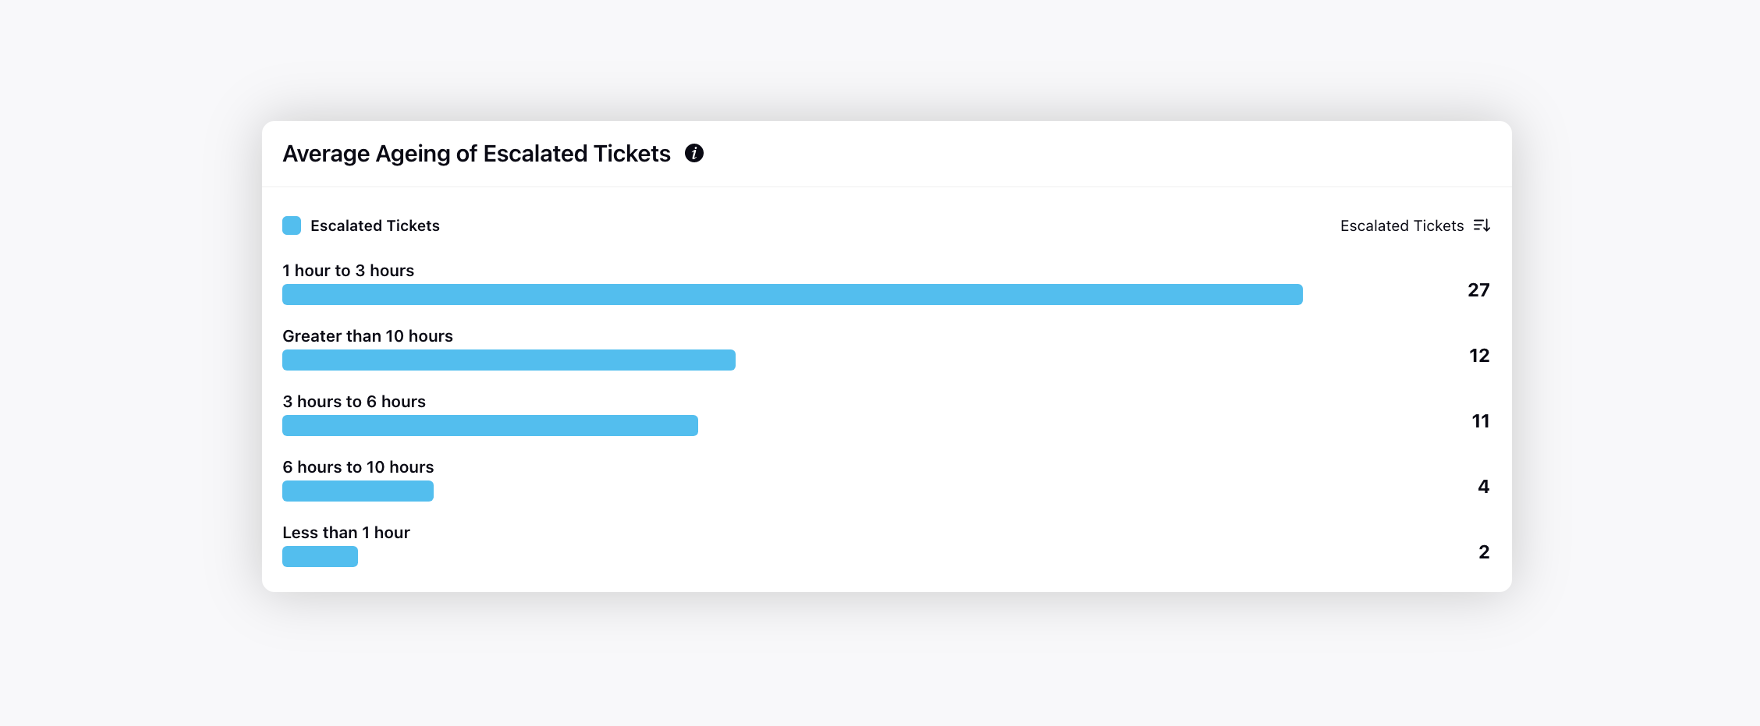 |
Issue wise split of Escalated Tickets | Displays the number and percentage of tickets Escalated for each issue.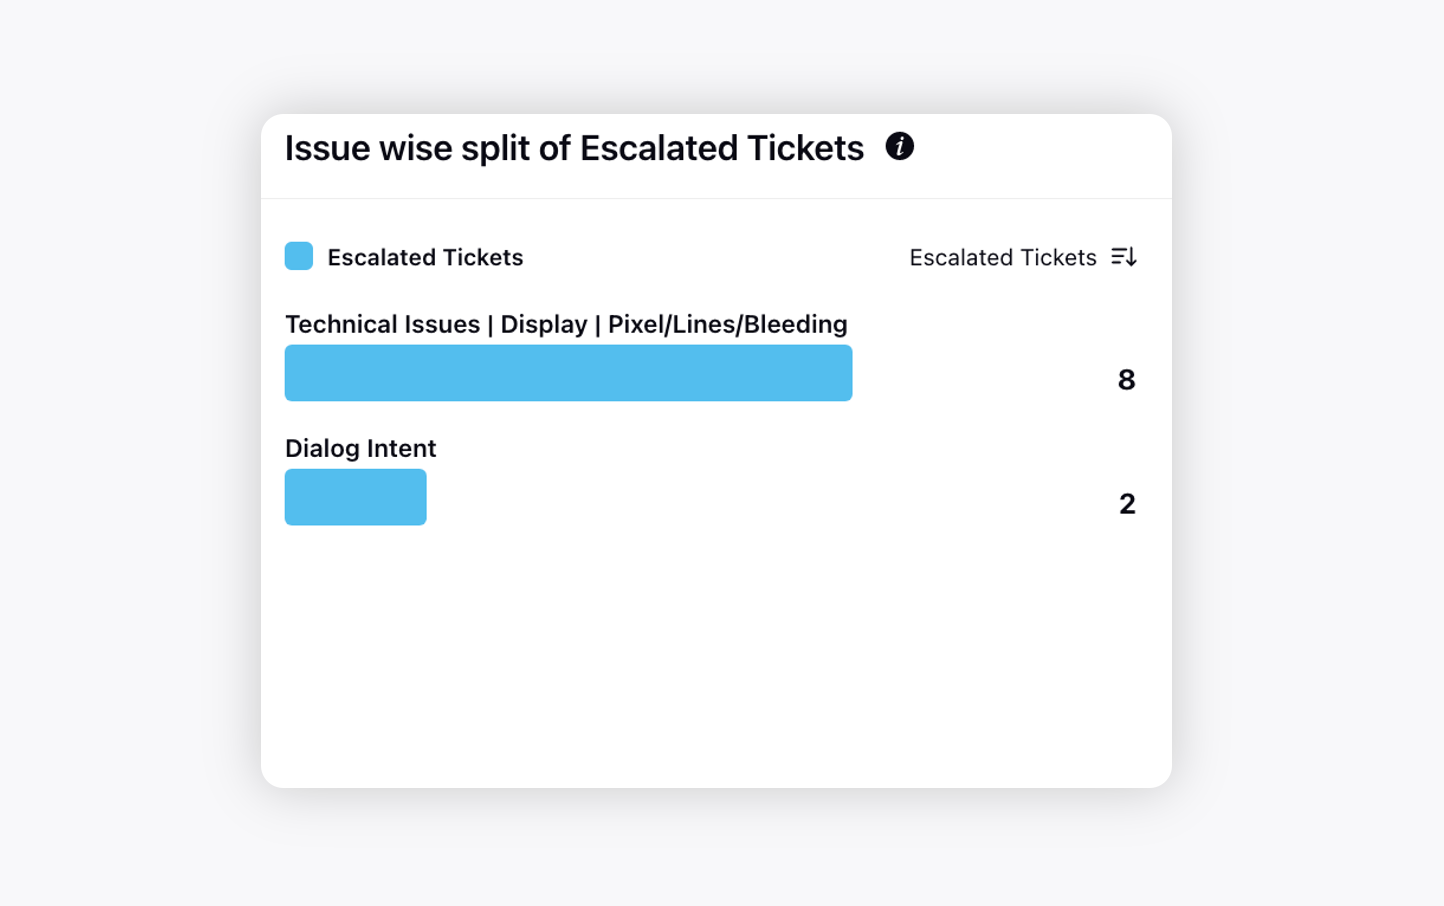 |
Platform wise split of Escalated Tickets | Displays which platform contributes the maximum and minimum tickets escalations.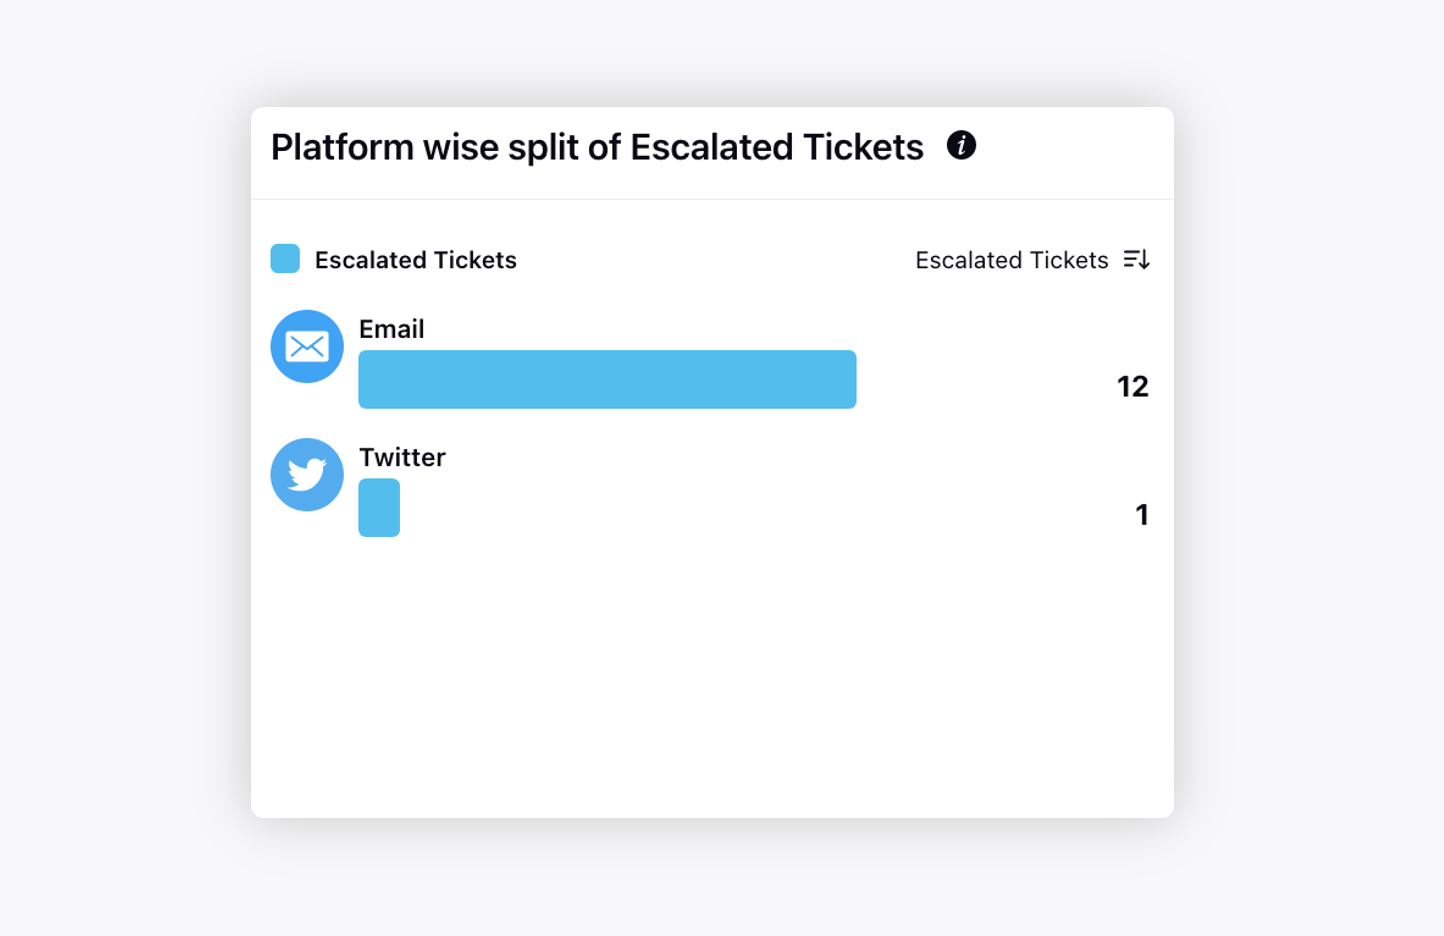 |
Priority wise split of Escalated Tickets | Displays which priority contributes to the maximum tickets escalations.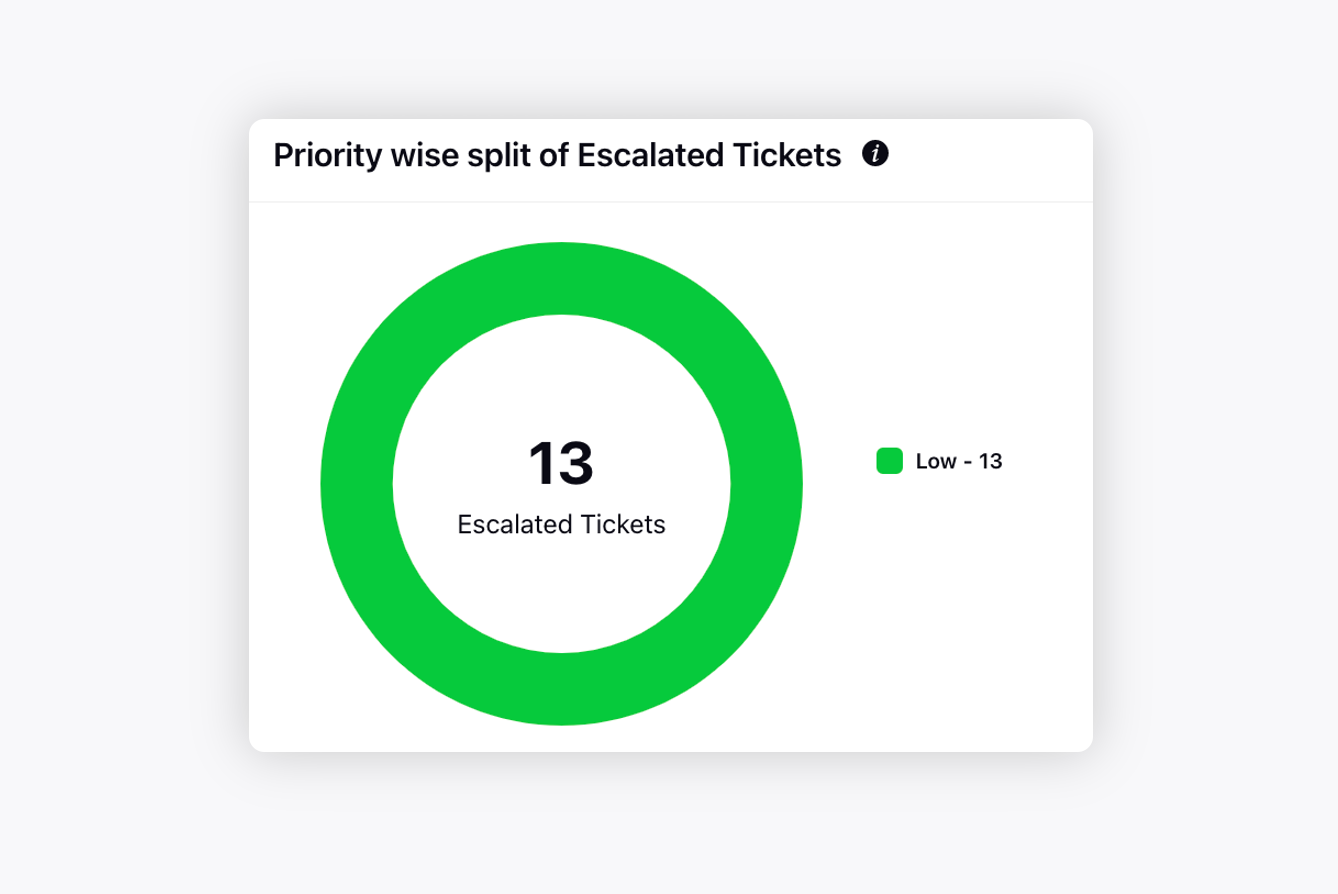 |
Team wise split of Escalated Tickets | Displays which teams had maximum and minimum escalations.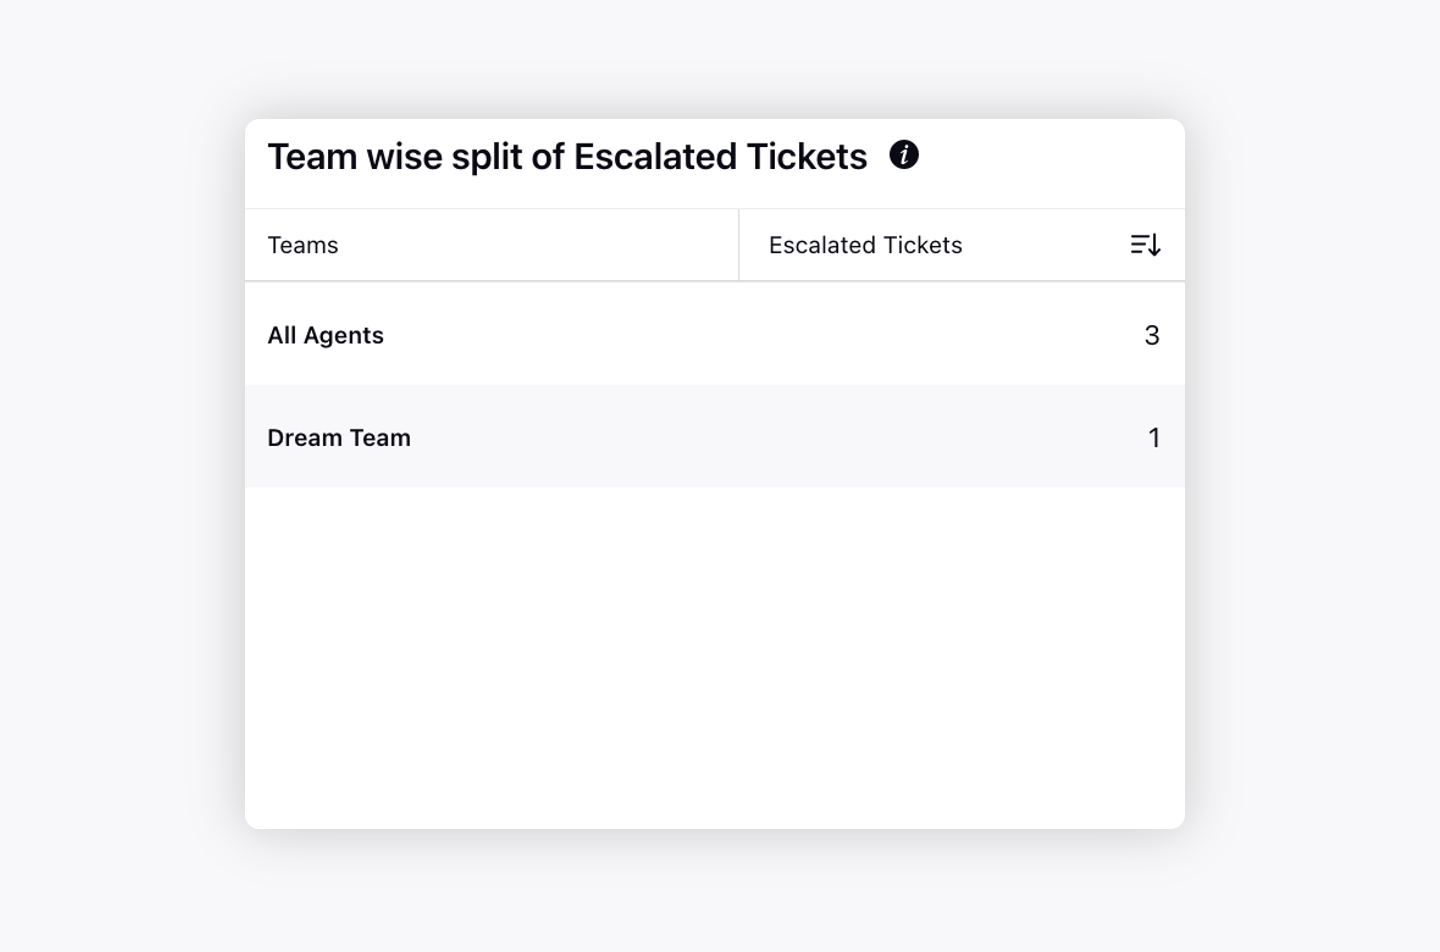 |
Agent wise split of Escalated Tickets | Displays which agents lead to maximum and minimum escalations.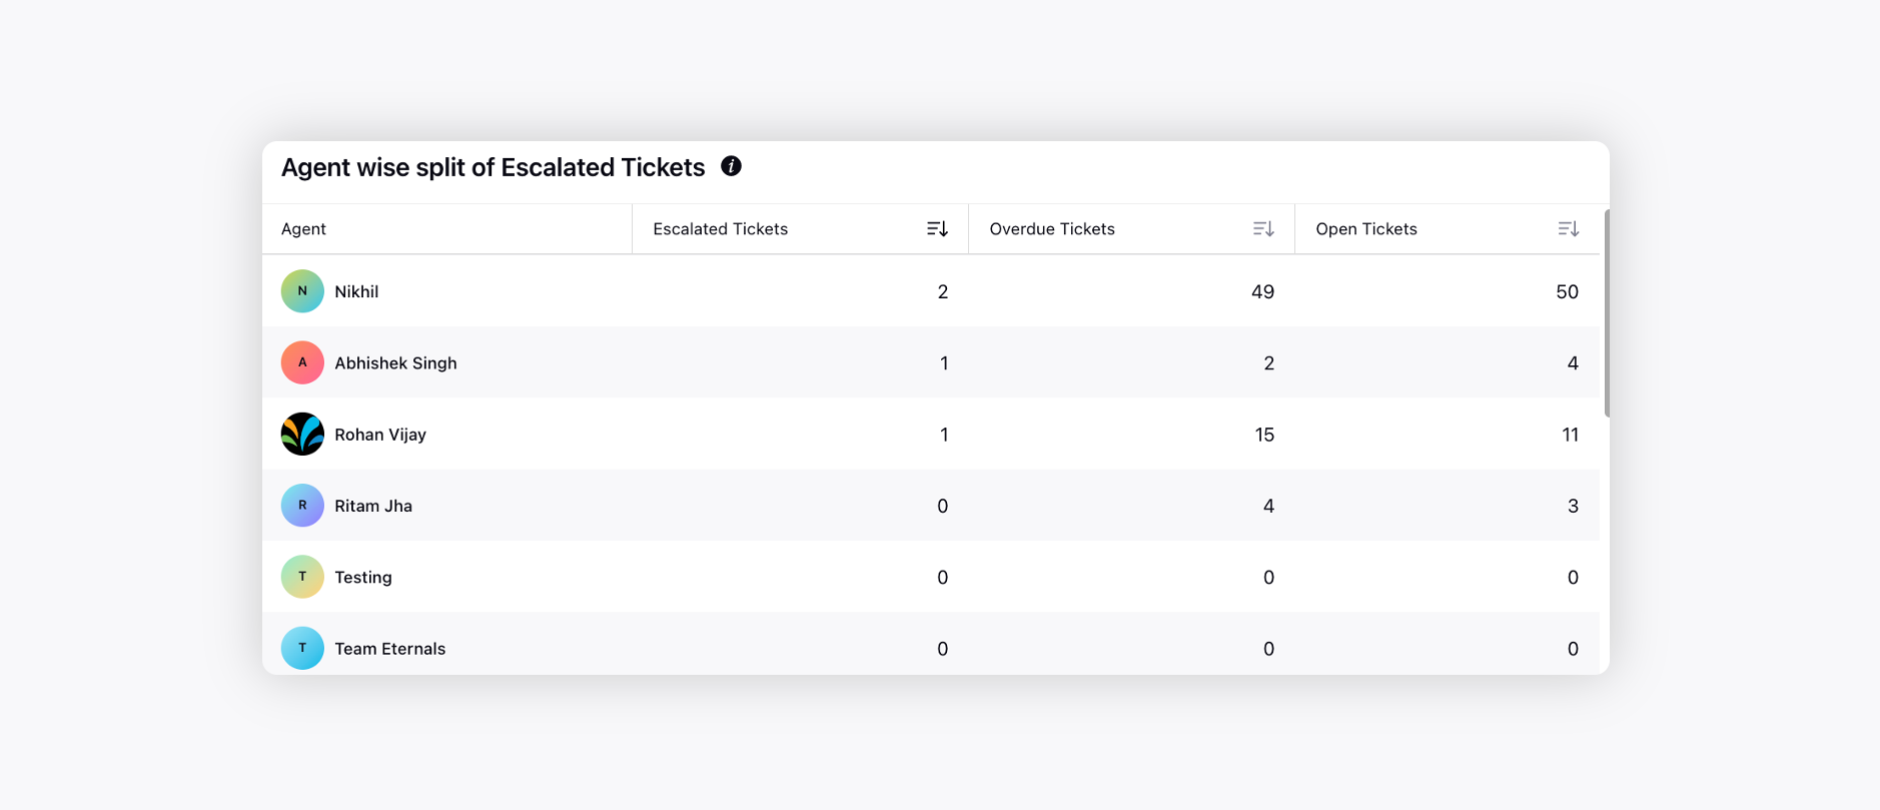 |
Overdue Tickets
Widget Name | Description |
Trend of Overdue Tickets | Displays the trend of overdue tickets over time.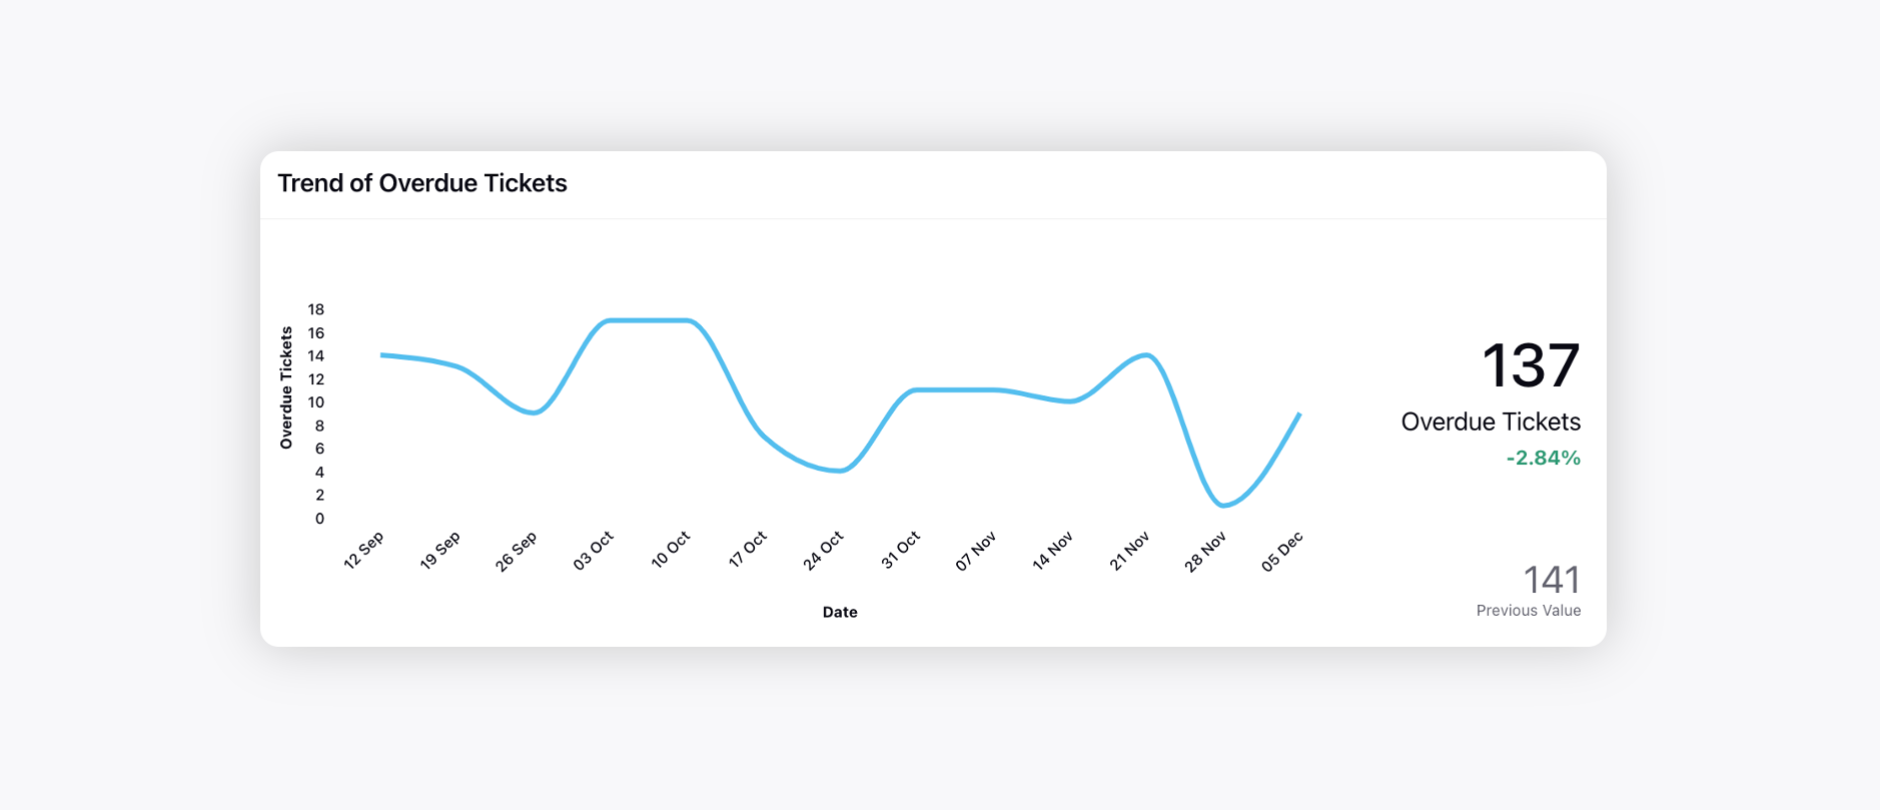 |
Issue wise split of Overdue Tickets | Displays the number and percentage of tickets overdue for each issue.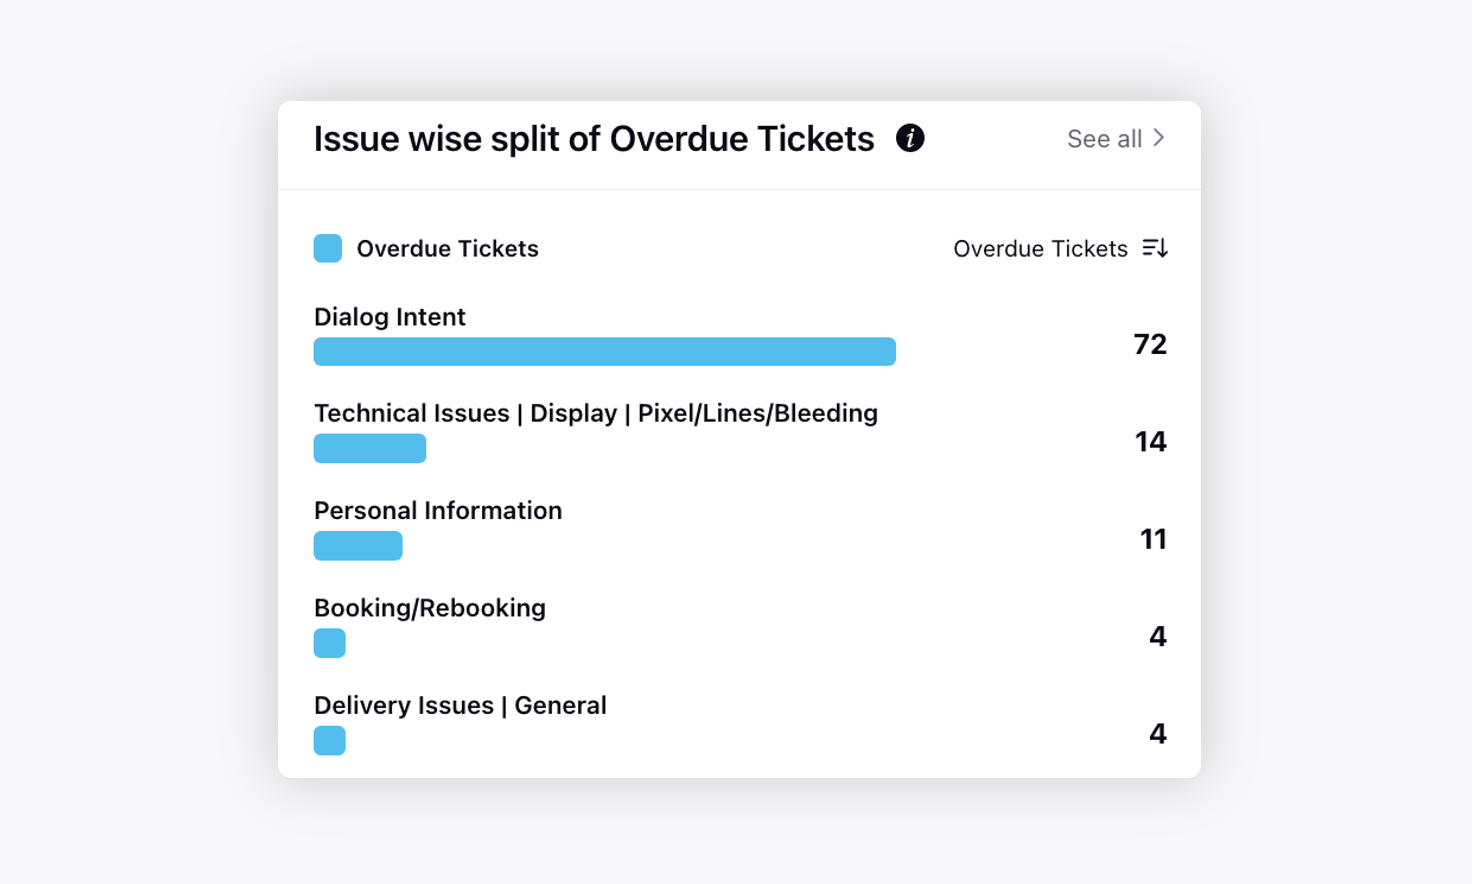 |
Platform wise split of Overdue Tickets | Displays which platform contributes to the maximum and minimum tickets overdue.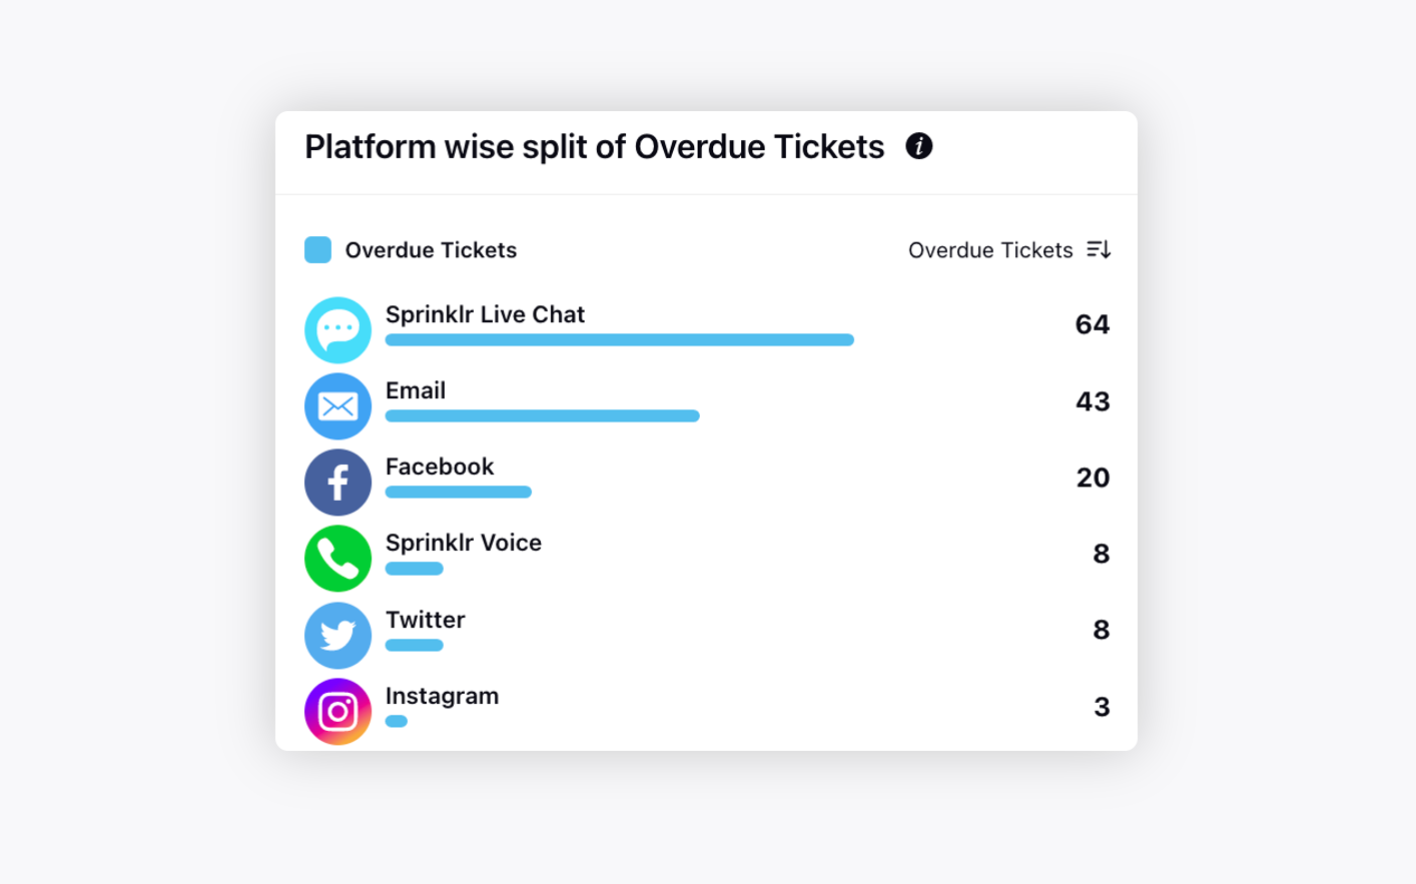 |
Priority wise split of Overdue Tickets | Displays which priority contributes to the maximum and minimum tickets overdue.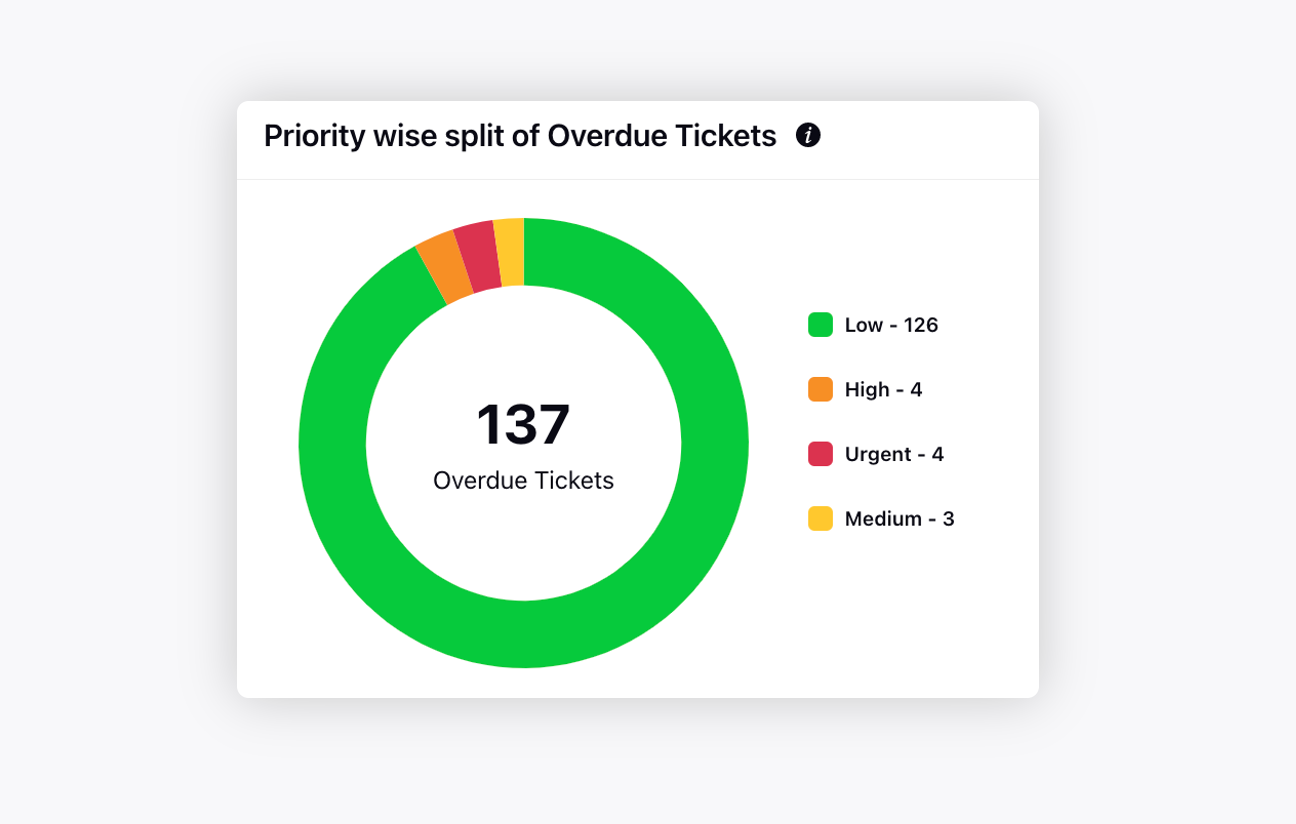 |
Team wise split of Overdue Tickets | Displays which teams lead to maximum and minimum overdue.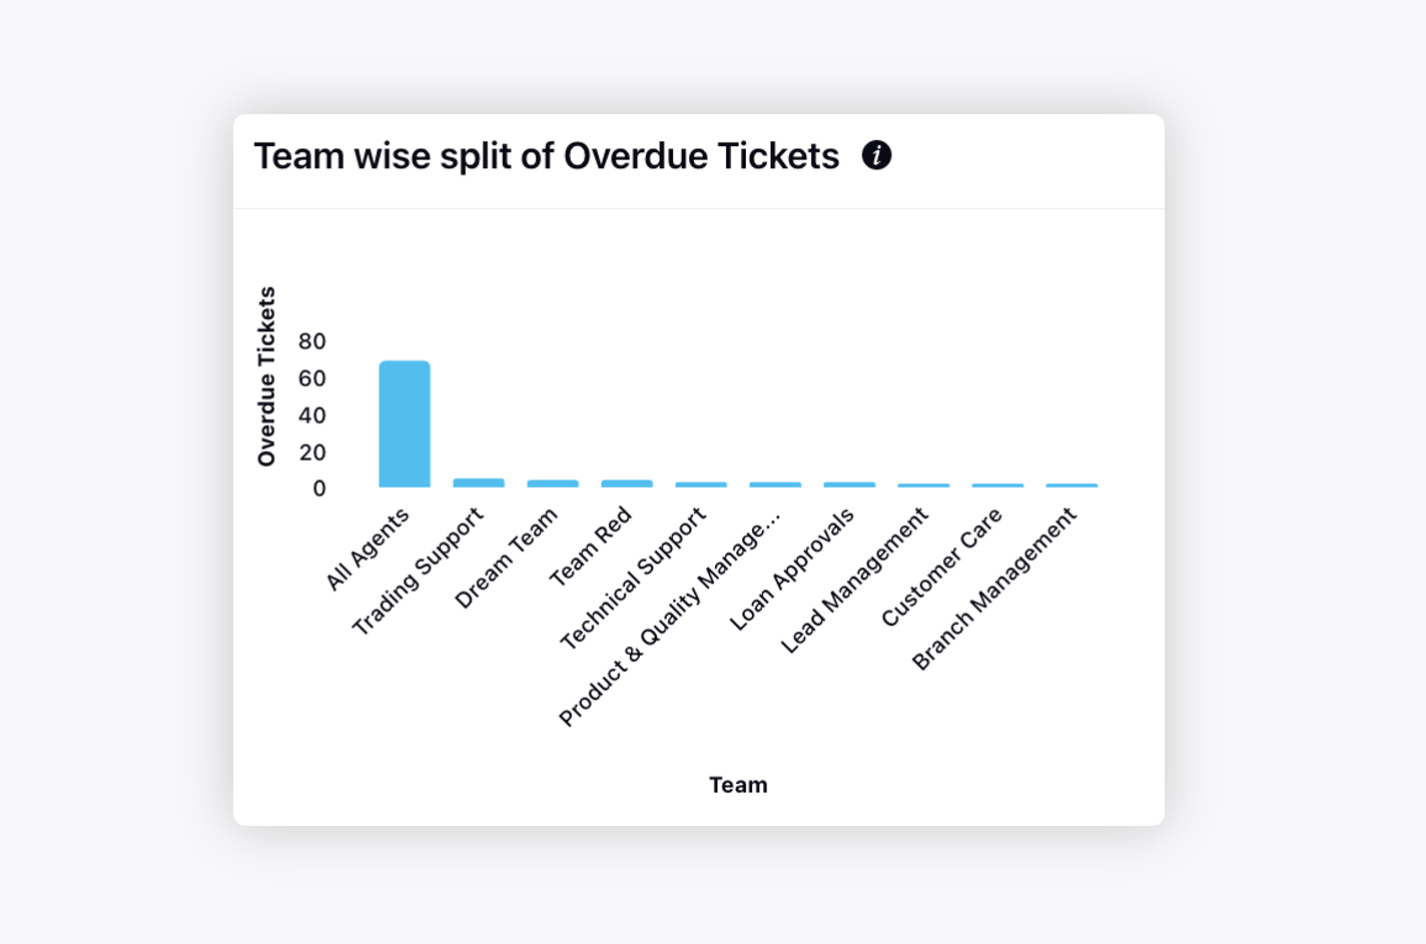 |
Agent wise split of Overdue Tickets | Displays which agents lead to maximum and minimum overdue.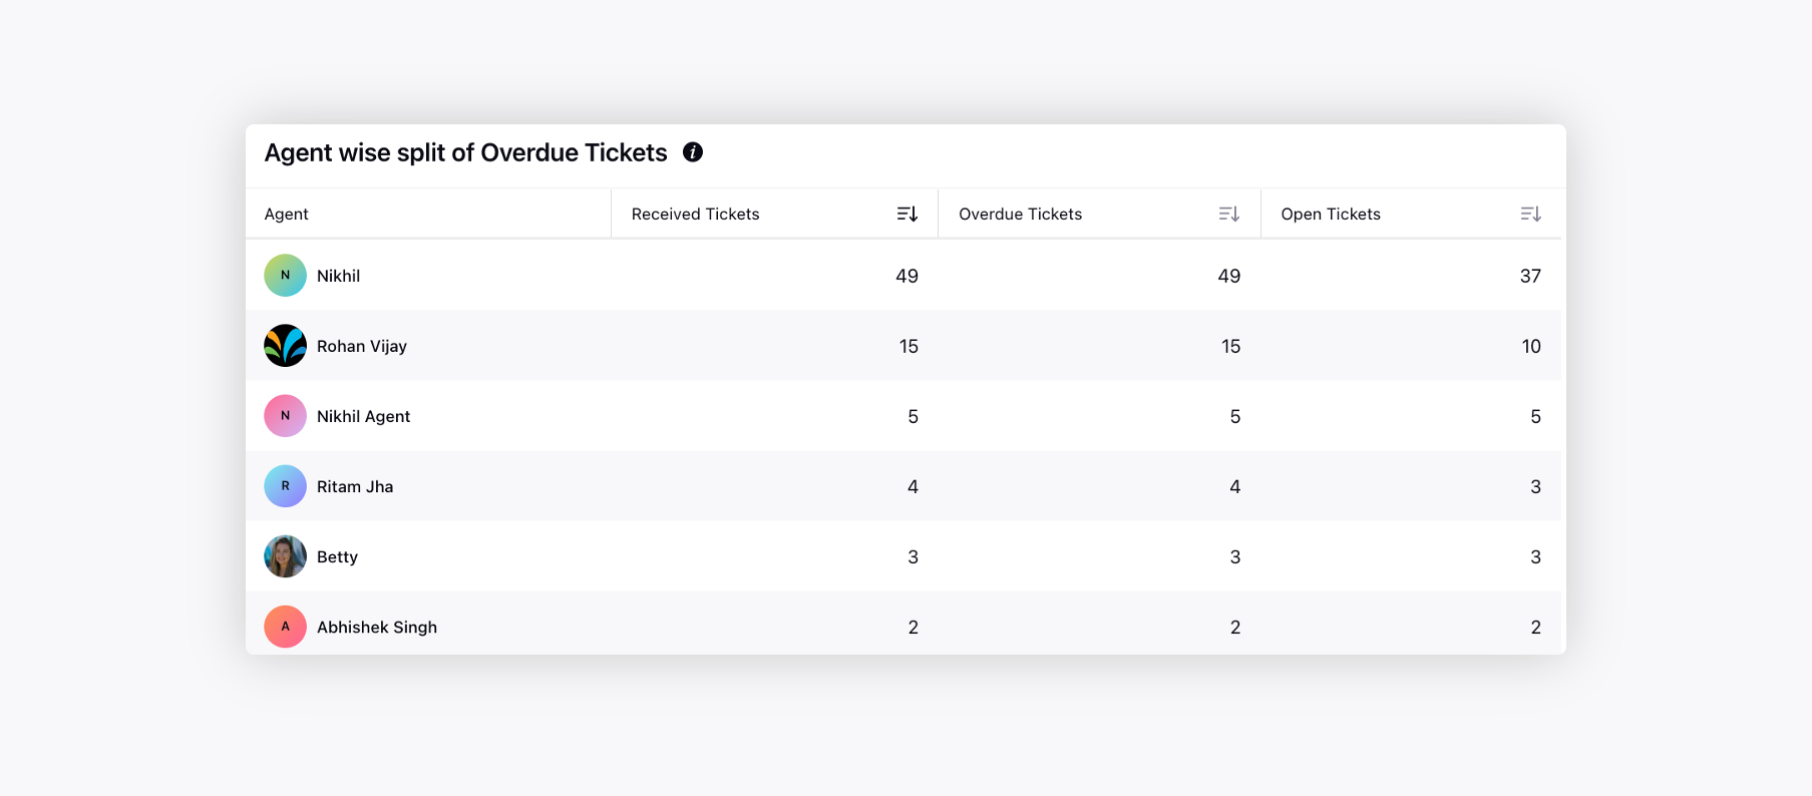 |
