Use the standard SLA Monitoring dashboard in Sprinklr Advanced to report and visualize if the SLA is executed based on the defined parameters.
SLA Monitoring Dashboard lays down specific widgets with all the relevant metrics, describing the parameters of the Response Time, Handling Time, and Resolution Time (which are different points of measurement) and their values. Tracking and monitoring the various data points are executed based on these parameters. The value for each SLA parameter is agreed upon between the organization and its clients. If there is any deviation from the SLA, various measurements can be taken to resolve the violation. SLA Monitoring Dashboard helps you find out exactly where the issue is and plan your resolution criteria based on those issues.
Navigate to SLA Monitoring Dashboard
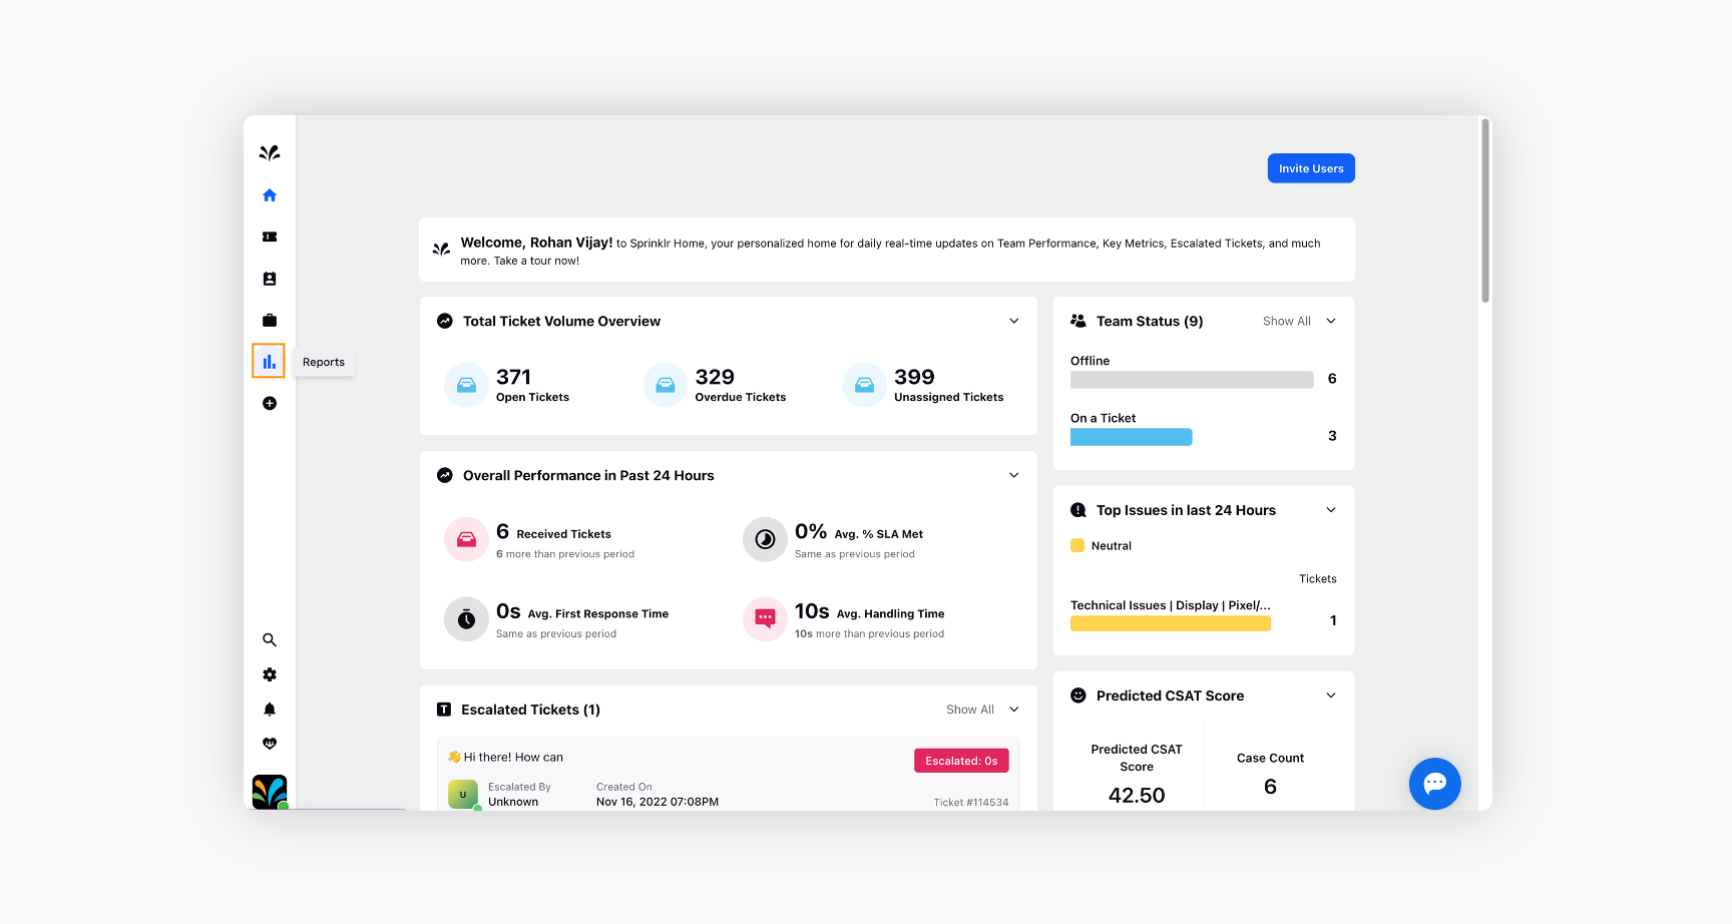
Log in to Care Console. On the Sprinklr Advanced window, click Reports icon on the left pane.
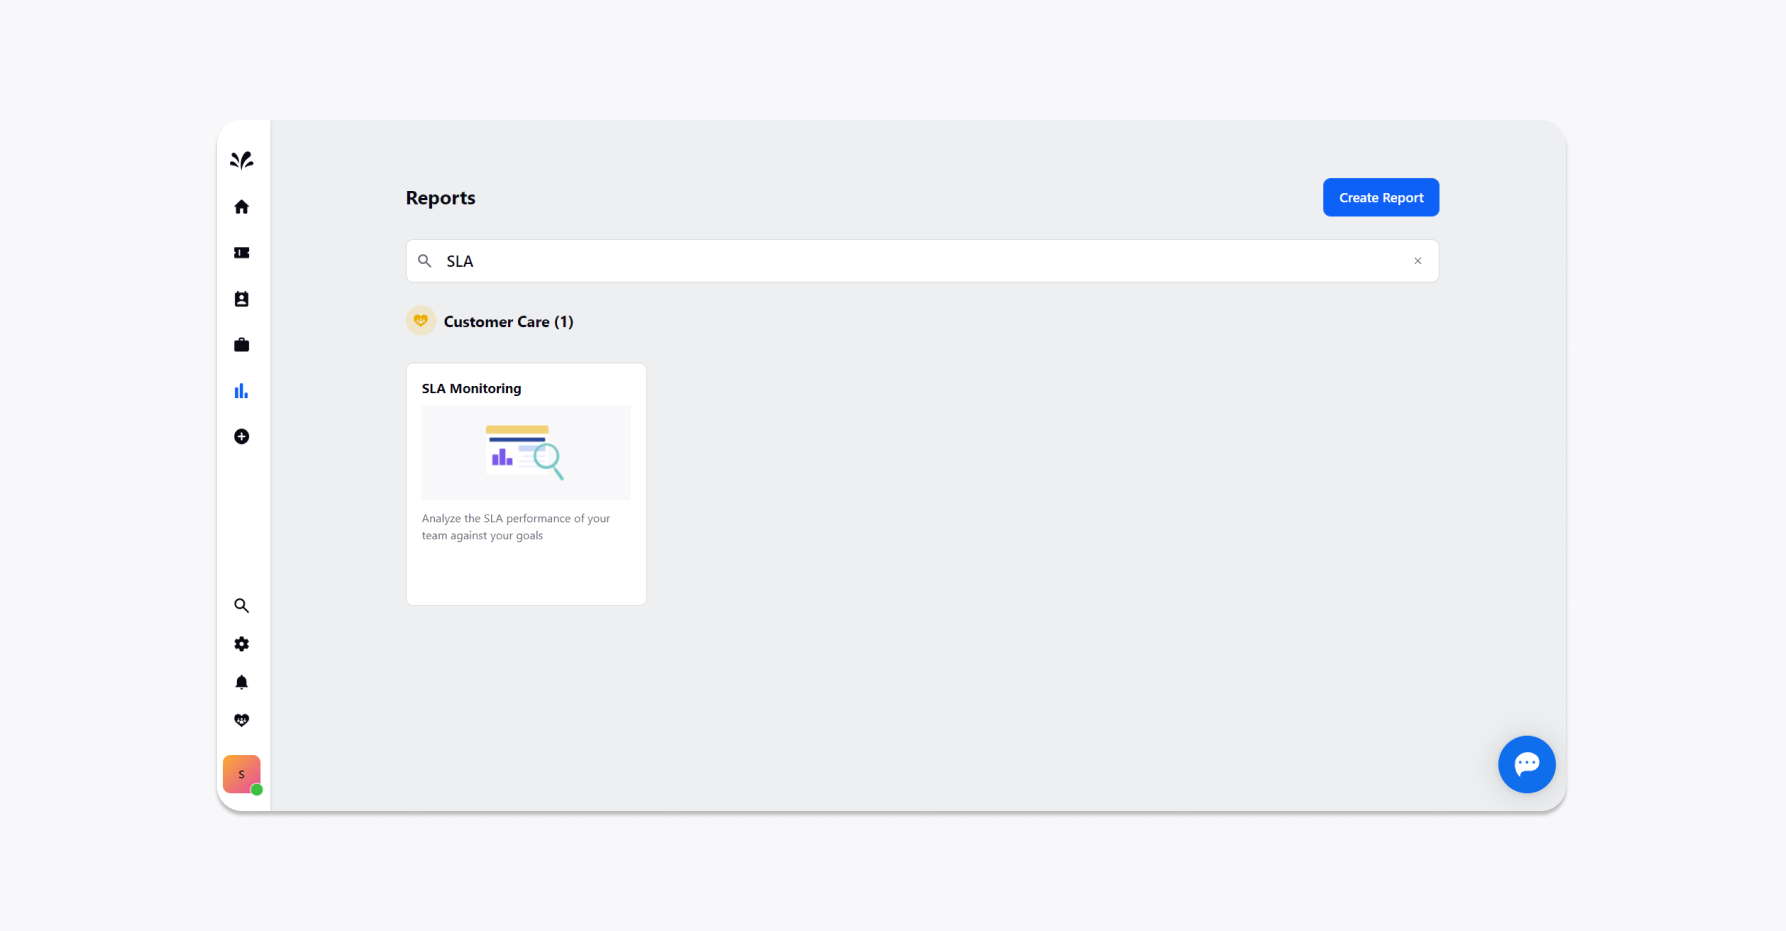
The SLA Monitoring Dashboard can be found in the Reporting section of Sprinklr Advanced.
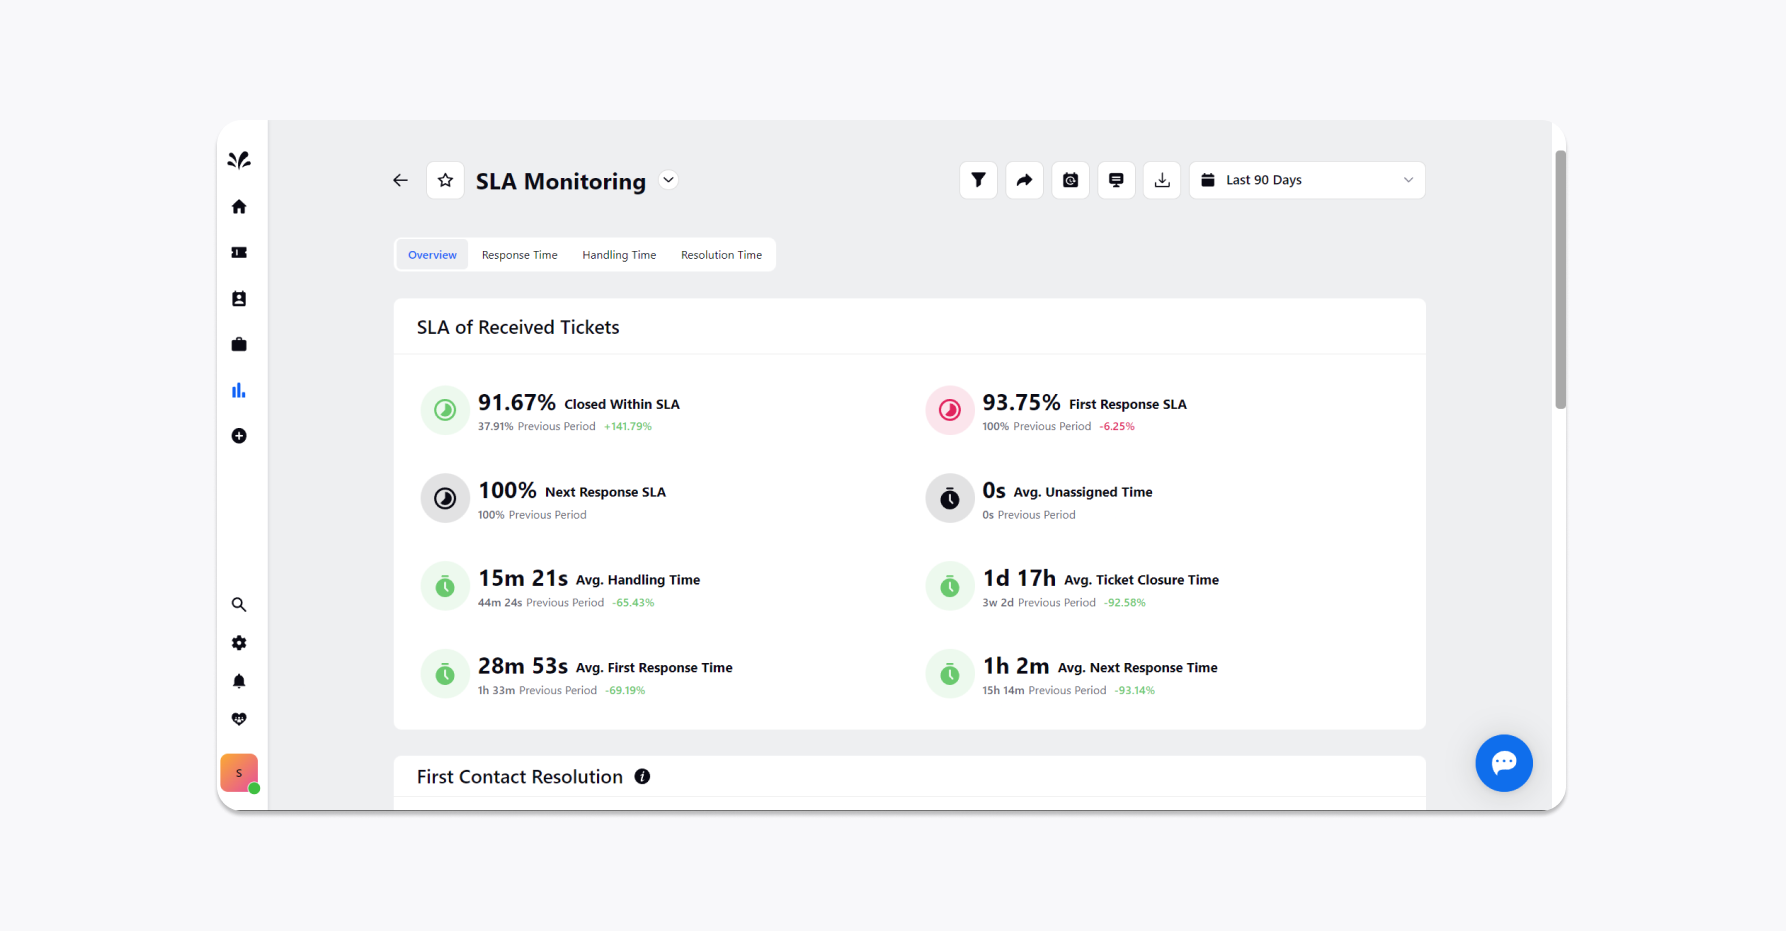
SLA Monitoring Dashboard consists of 4 different tabs, i.e. Overview, Response Time, Handling Time, and Resolution Time. Below, you can find an elaborated description for each of the widgets.
Overview
Widget Name
Description
SLA of Received Tickets
Displays the SLAs of overall tickets.
First Contact Resolution
Displays the overall percentage of tickets closing within the first contact.
Response Time by Day
Displays the overall response time by the day.
SLA % Trend Over Time
Displays the overall SLA% trend.
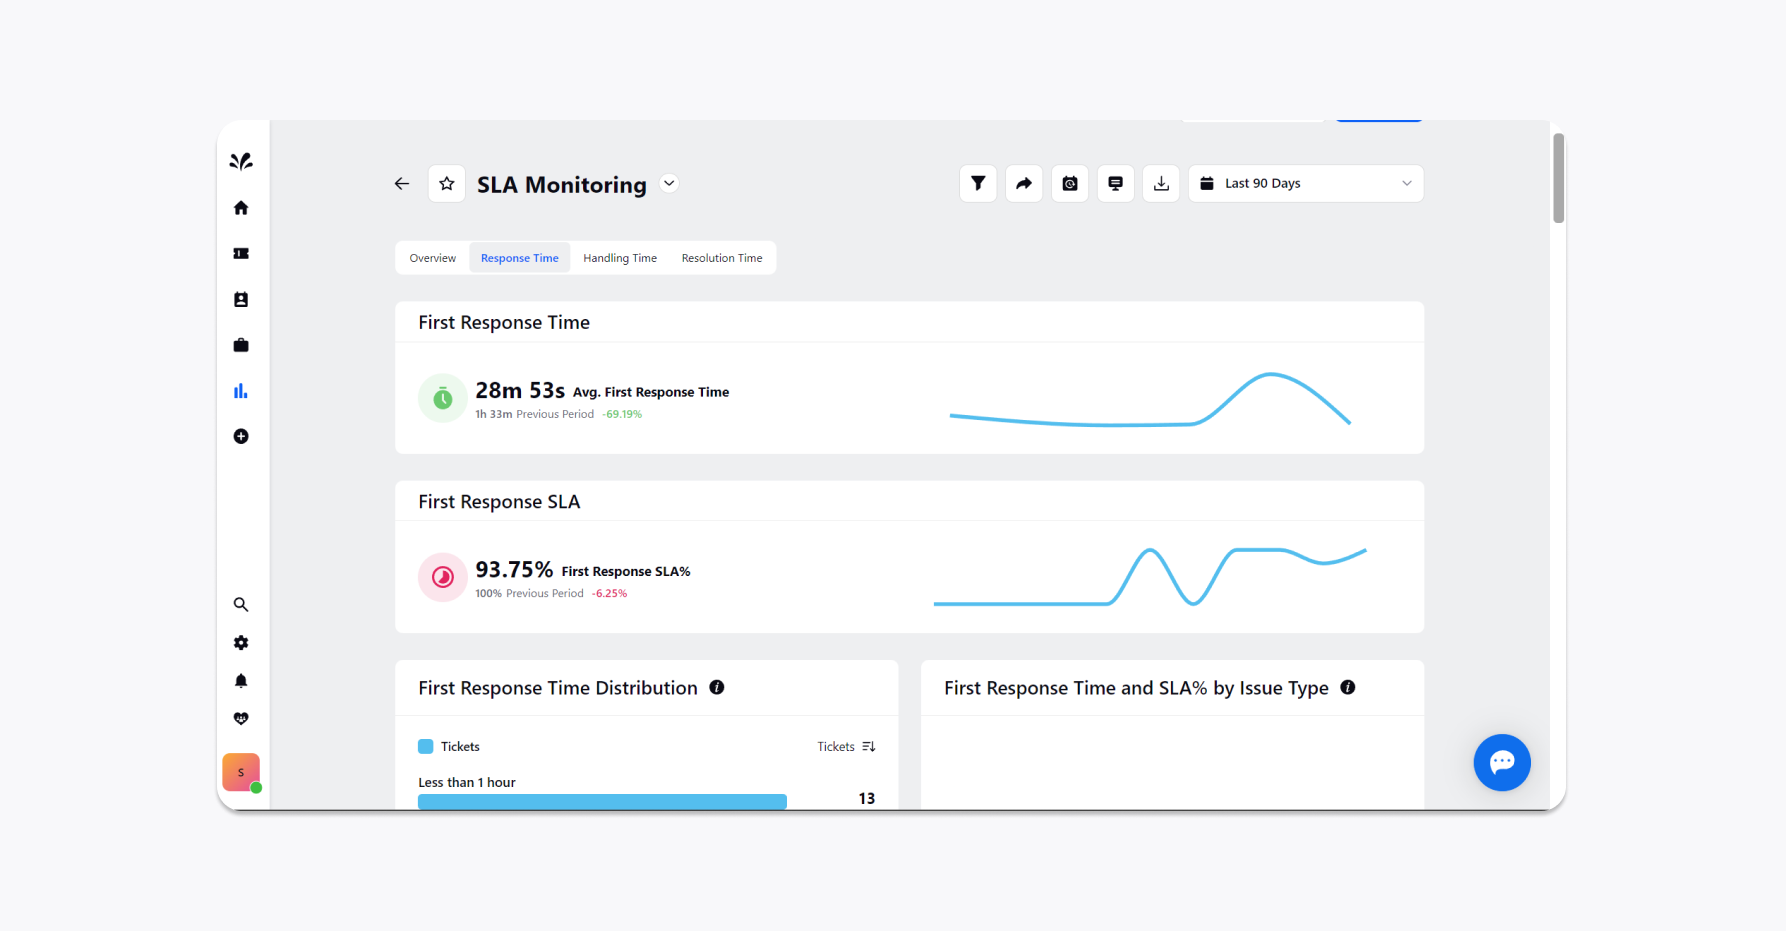
Response Time
Widget Name
Description
First Response Time
Displays the average first response time across the platform.
First Response SLA
Displays the average first response SLA across the platform.
First Response Time Distribution
Displays the number of tickets falling in each time bracket to understand the overall time spread.
First Response Time and SLA% by Issue Type
Displays the overall time performance issue-wise to gauge if your support team is able to reply quickly to enough tickets.
First Response Time and SLA% by Platform
Displays the overall time performance platform-wise and if your support team is able to reply quickly to enough tickets for each platform.
First Response Time by Priority
Displays the overall first response time performance priority-wise.
First Response SLA% by Priority
Displays if the support team is able to reply quickly to enough tickets of each priority.
Agent's First Response Time
Displays the agent's average first response time across the platform.
First Response Time of each Agent
Displays how each agent is performing and who is lagging in terms of efficiency and meeting SLA%.
Team's First Response Time
Displays the team’s average first response time across the platform.
First Response Time of each Team
This widget helps you understand how each team is performing and who is lagging in terms of efficiency and unable to meet SLA%.
Next Response Time
Next Response Time
Displays the average next response time across the platform.
Next Response SLA%
Displays the average next response SLA % across the platform.
Next Response Time and SLA% by Issue Type
Displays the overall next response time performance issue-wise to gauge if your support team is able to reply quickly to all messages.
Next Response Time and SLA% by Platform
Displays the overall next response time performance of your support team platform-wise and is your support team able to reply quickly to enough messages.
Next Response Time by Priority
Displays the overall next response time performance of your support team Priority wise and is your support team able to reply quickly.
Next Response SLA% by Priority
Displays the overall next response SLA% performance of your support team priority-wise and is your support team able to reply quickly to enough messages.
Agent Next Response Time
Displays the agent's average next response time across the platform.
Next Response Time of each Agent
Displays how each agent is performing and who is lagging in terms of efficiency and the ability to meet SLA%.
Team Next Response Time
Displays the team’s average next response time across the platform.
Next Response Time of each Team
Displays how each team is performing and who is lagging in terms of efficiency and the ability to meet SLA%.
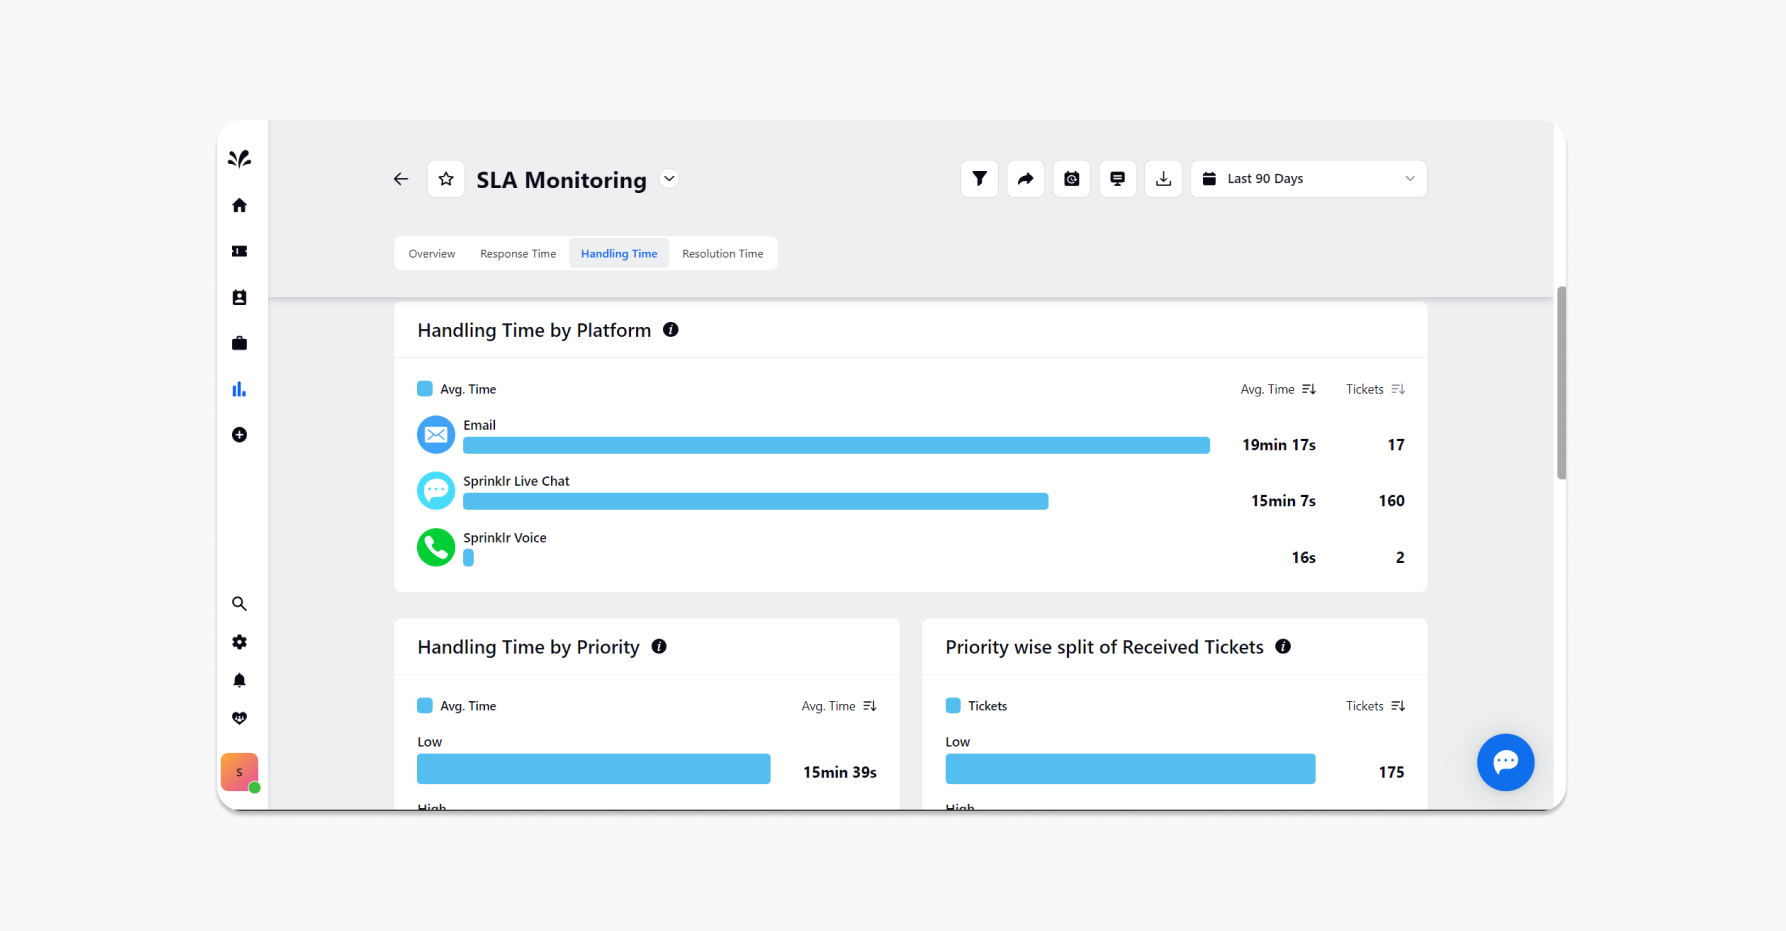
Handling Time
Widget Name
Description
Handling Time Overview
Displays your team’s average ticket handling time and trend.
Handling Time by Issue Type
Displays the overall handling time issue-wise to gauge if your support team is able to handle all issues quickly.
Handling Time by Platform
Displays the overall handling time platform-wise to gauge if your support team is able to handle all issues quickly.
Handling Time by Priority
Displays the overall handling time priority-wise to gauge if your support team is able to handle high-priority tickets quickly.
Priority wise split of Received Tickets
Displays the split of received tickets priority-wise to gauge how many tickets are in each category.
Average Handling Time of all Agents
Displays all agents' overall average issue handling time.
Handling Time of each Agent
Displays how each agent is performing and who is lagging in terms of the efficiency of handling tickets.
Average Handling Time of all Teams
Displays all the teams' overall average issue handling time.
Handling Time of each Team
Displays how each team is performing and which one is lagging in terms of the efficiency of handling tickets.
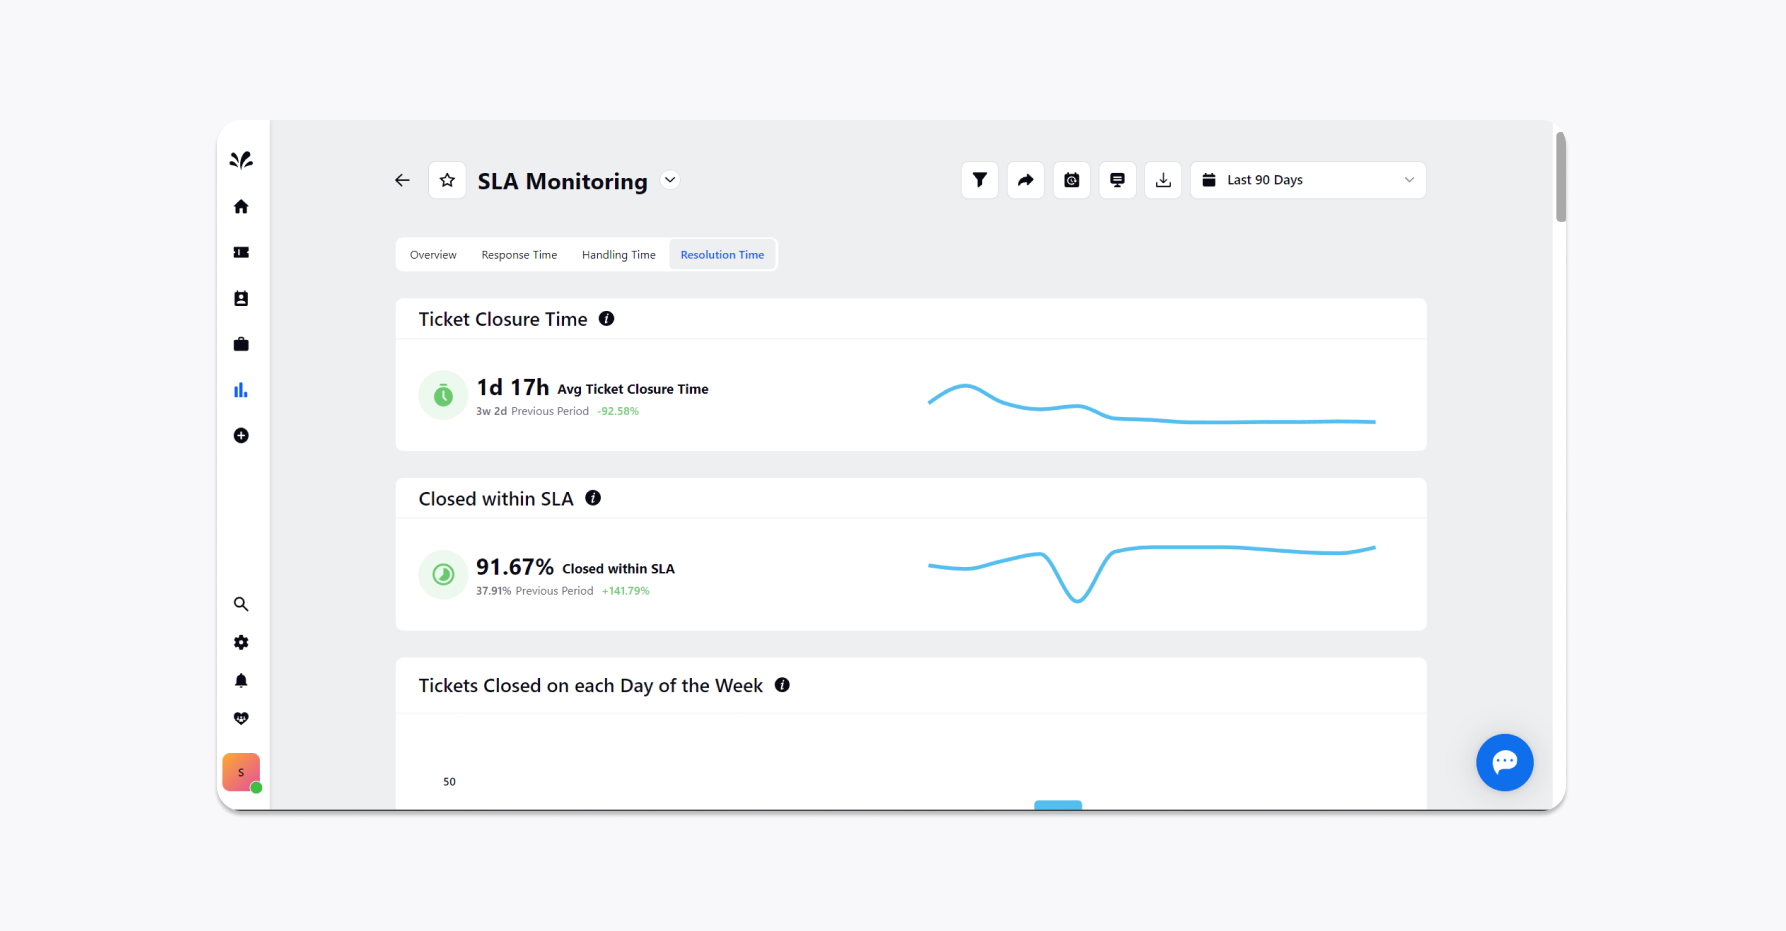
Resolution Time
Widget Name
Description
Ticket Closure Time
Displays your team’s average ticket closure time.
Closed within SLA
Displays the % of tickets closed within the specified SLA.
Tickets Closed on each Day of the Week
Displays the number of tickets closed on an average on each day of the week in the selected time period.
Closure Time and SLA% by Issue Type
Displays the overall closure time for different issues to gauge if your team is able to close enough tickets within the specified SLA.
Closure Time and SLA% by Platform
Displays the overall closure time for different platforms to gauge if your team is able to close enough tickets within the specified SLA.
Closure Time by Priority
Displays the overall ticket closure time for different priorities.
Closure SLA% by Priority
Displays if your support team is able to close enough tickets within the specified SLA for each priority.
Average Closure Time of all Agents
Displays all agents' average ticket closure time.
Closure Time of each Agent
Displays how each agent is performing and which agent is lagging in terms of the efficiency of closing tickets within SLA.
Average Closure Time of all Teams
Displays all teams' average ticket closure time.
Closure Time of each Team
Displays how each team is performing and which team is lagging in terms of the efficiency of closing tickets within SLA.
First Contact Resolution
First Contact Resolution Overview
Displays the overall % of the first contact resolution provided by your team and its trend over the selected period.
First Contact Resolution split by Issue Type
Displays the split of first contact resolution for different issues to gauge which issues tickets contribute maximum to FCR.
First Contact Resolution by Issue
Displays the overall first contact resolution for various issues to gauge what percentage of tickets of each case get closed within the first contact.
First Contact Resolution by Platform
Displays the overall first contact resolution for different platforms to gauge what percentage of tickets of each platform get closed within the first contact.
First Contact Resolution split by Priority
Displays the split of first contact resolution for different priorities to gauge which priority tickets contribute maximum to FCR.
First Contact Resolution by Priority
Displays the overall first contact resolution for different priorities to estimate what percentage of tickets get closed within the first contact.
First Contact Resolution of Each Agent
Displays the performance of each agent in closing tickets within the first contact.
First Contact Resolution of Each Team
Displays the performance of each team in closing tickets within the first contact.