Track your team’s or agent’s performance and help them improve with the standard Team Performance Overview dashboard in Sprinklr Service.
Team Performance Overview dashboard consists of widgets that highlight the performance of your teams as per their work assignments. You can track the overall team performance, the number of tickets received, login hours, ticket handling time, CSAT scores, and more.
Additionally, you can track the overall performance of your agents based on their login hours, the number of tickets they have worked on, handling time, etc.
Tracking agents’ or teams’ performance is very useful to find those who are lagging and help them improve their performance. Also, it helps see who your constant top performers are. It allows you to see the performance improvement and decide to invest in that particular team or agent further.
The Team Performance Overview dashboard consists of 3 tabs, i.e., Overview, Teams, and Agents. Below, you can find an elaborated description for each of the widgets.
Overview
Widget Name | Description |
Team Performance Overview | Displays the overall team performance with respect to the total received tickets, ticket closure SLA%, login hours, average ticket handling time, etc.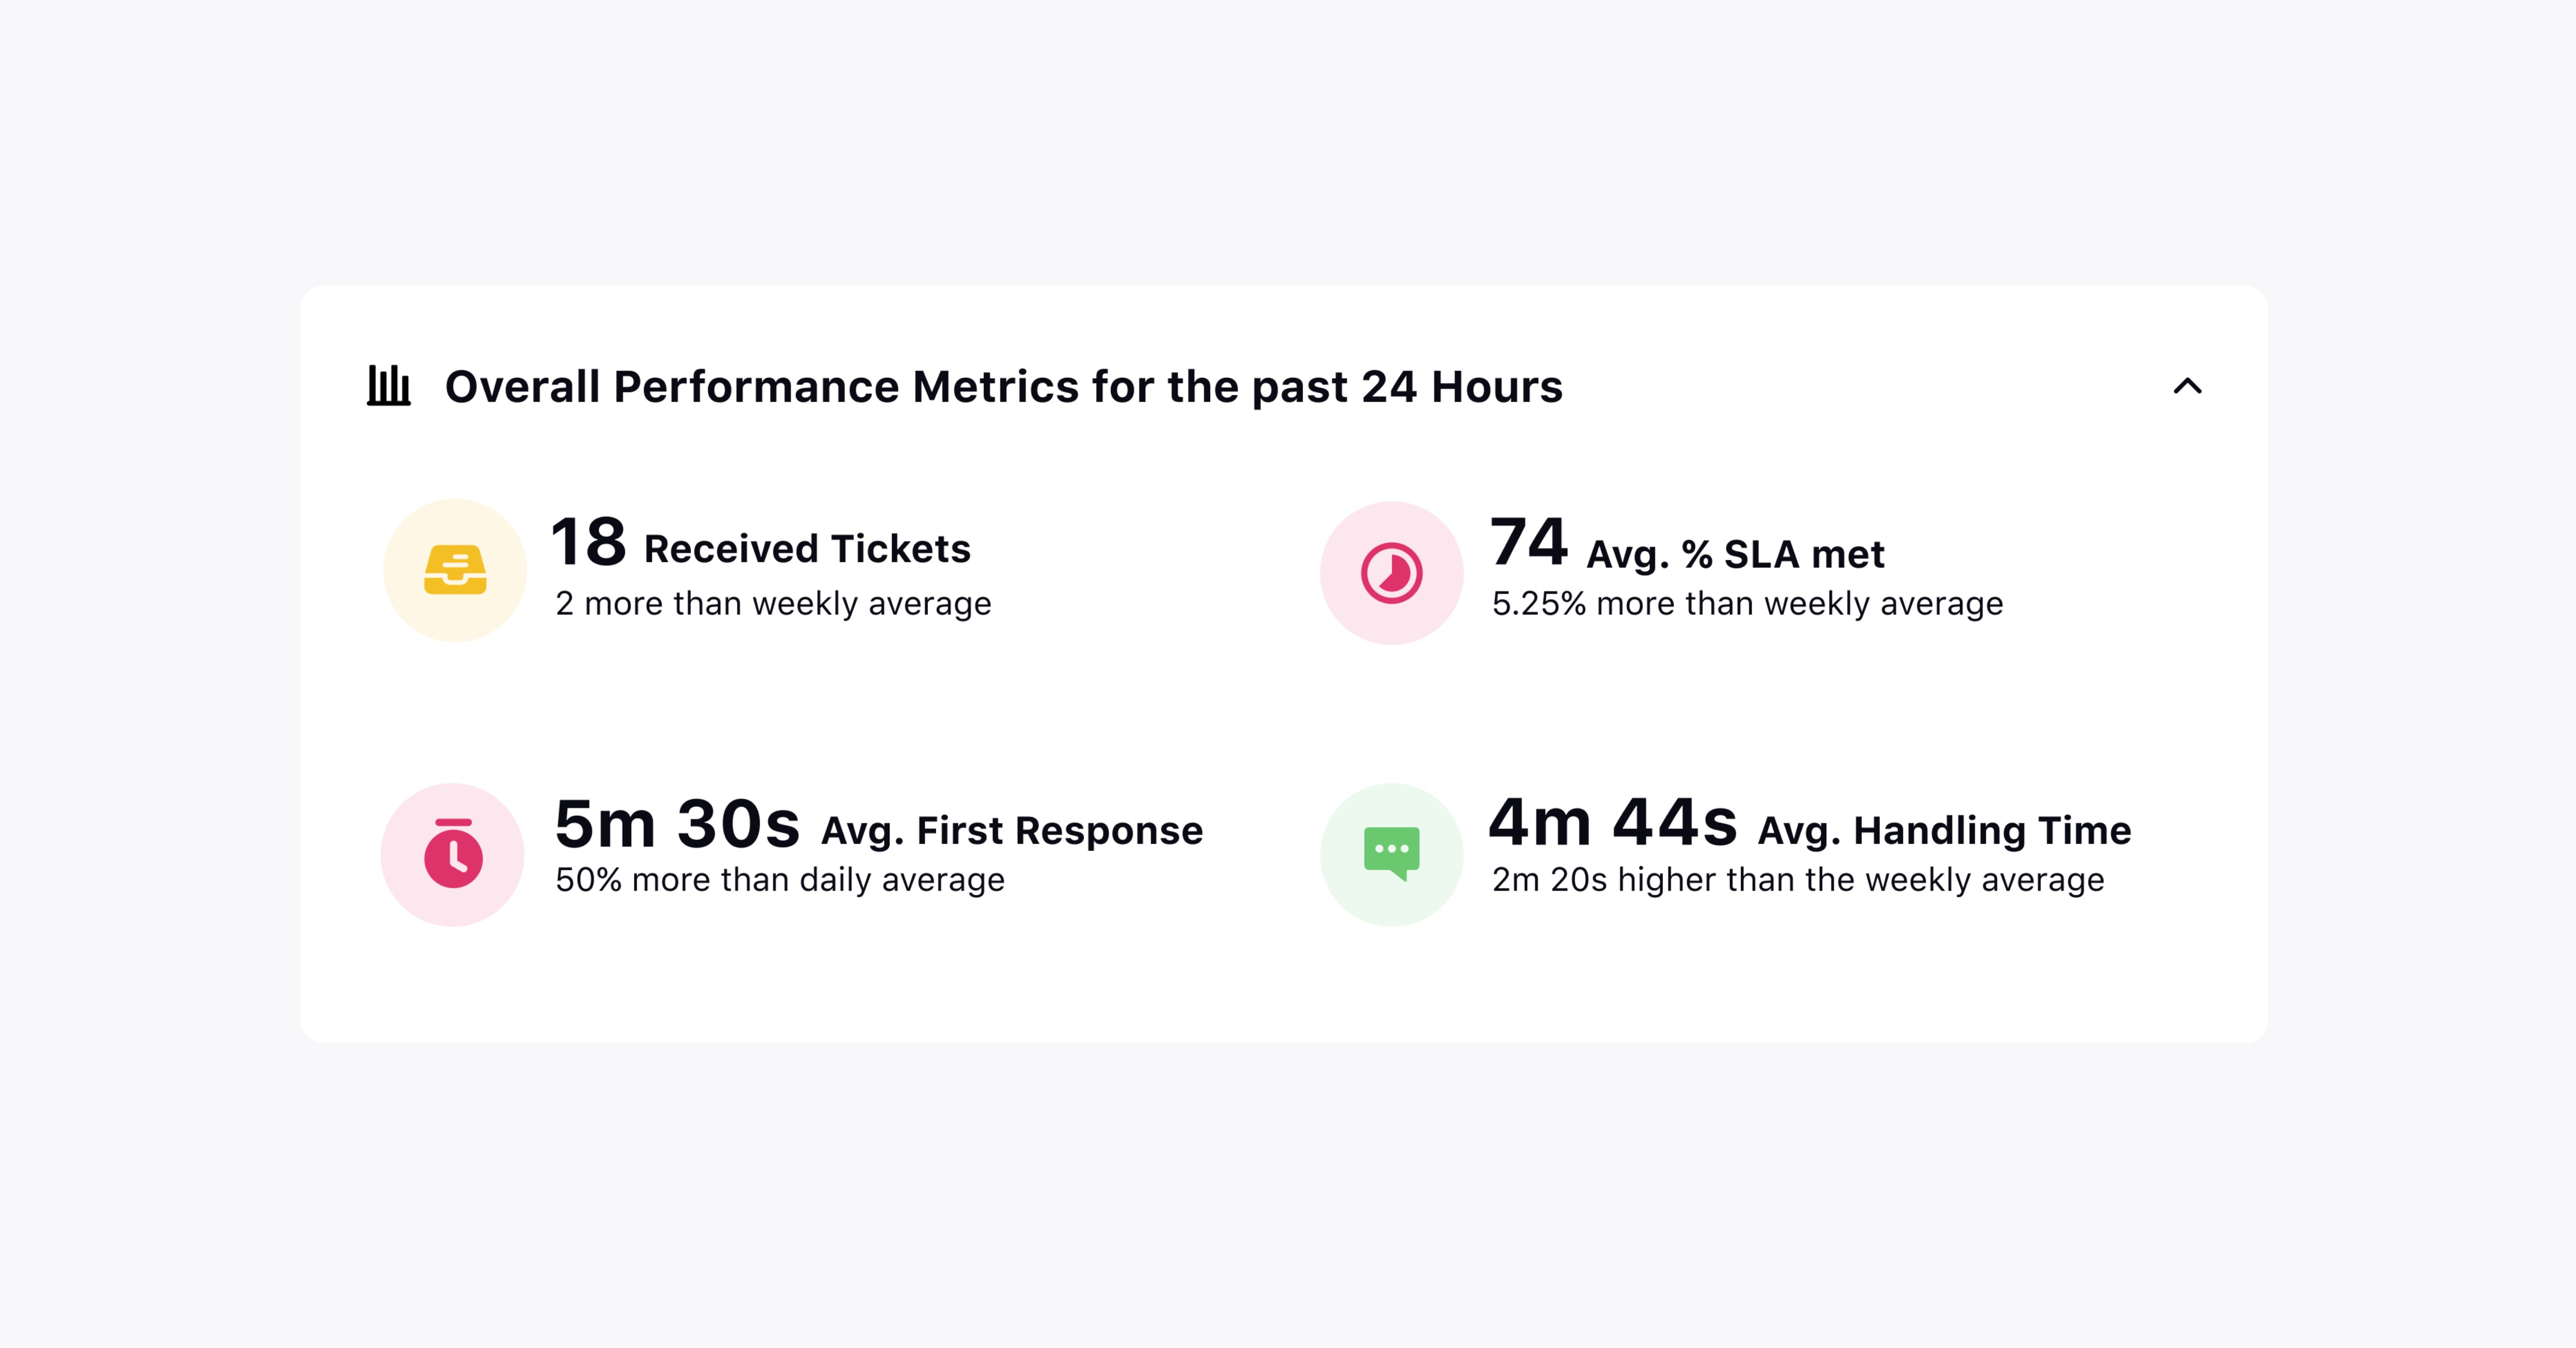 |
Team Performance | Displays the performances of each team in your workspace with respect to received tickets, ticket closure SLA%, average login time, average handling time, and predicted CSAT score.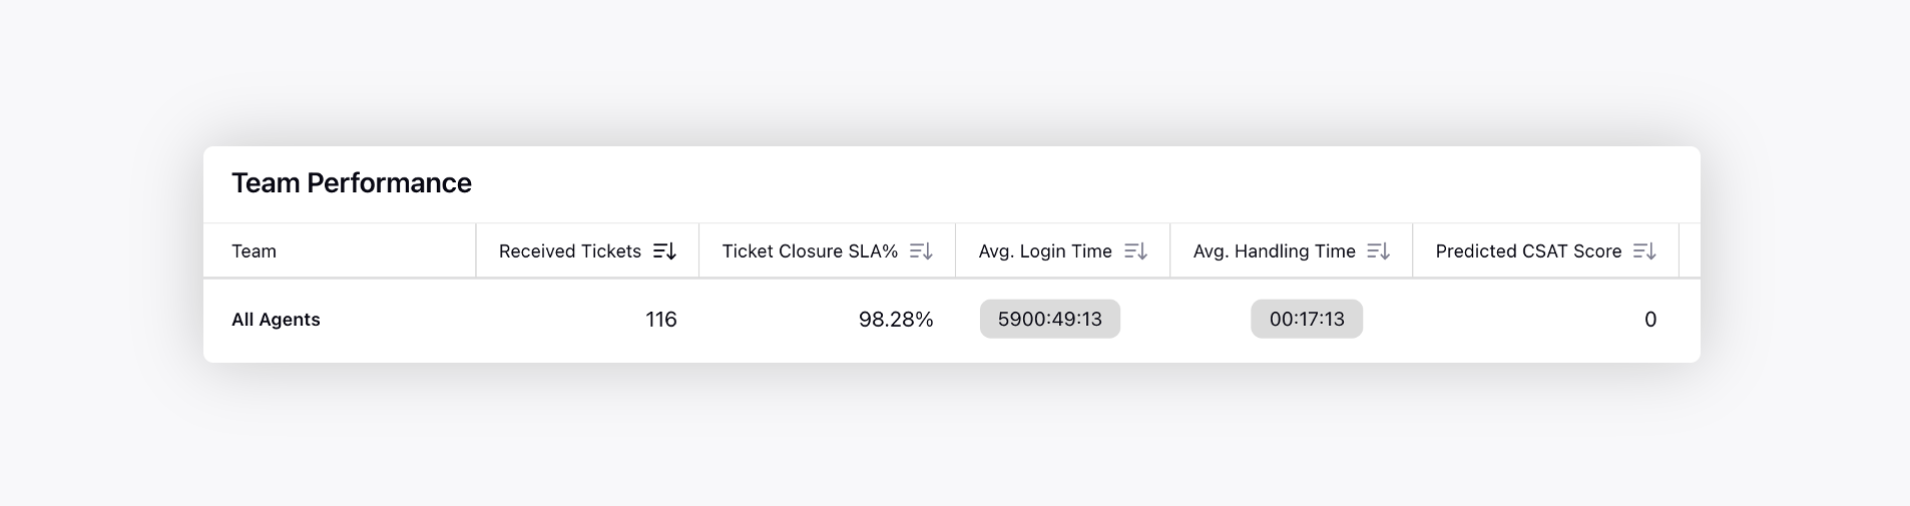 |
Agent Performance | Displays the performances of each agent in your workspace with respect to received tickets, ticket closure SLA%, average login time, average handling time, and predicted CSAT score. |
Teams
Widget Name | Description |
Team Performance | Displays the performances of each team in your workspace with respect to received tickets, ticket closure SLA%, average login time, average handling time, predicted CSAT score, reopened tickets, average first response time, and first response SLA%.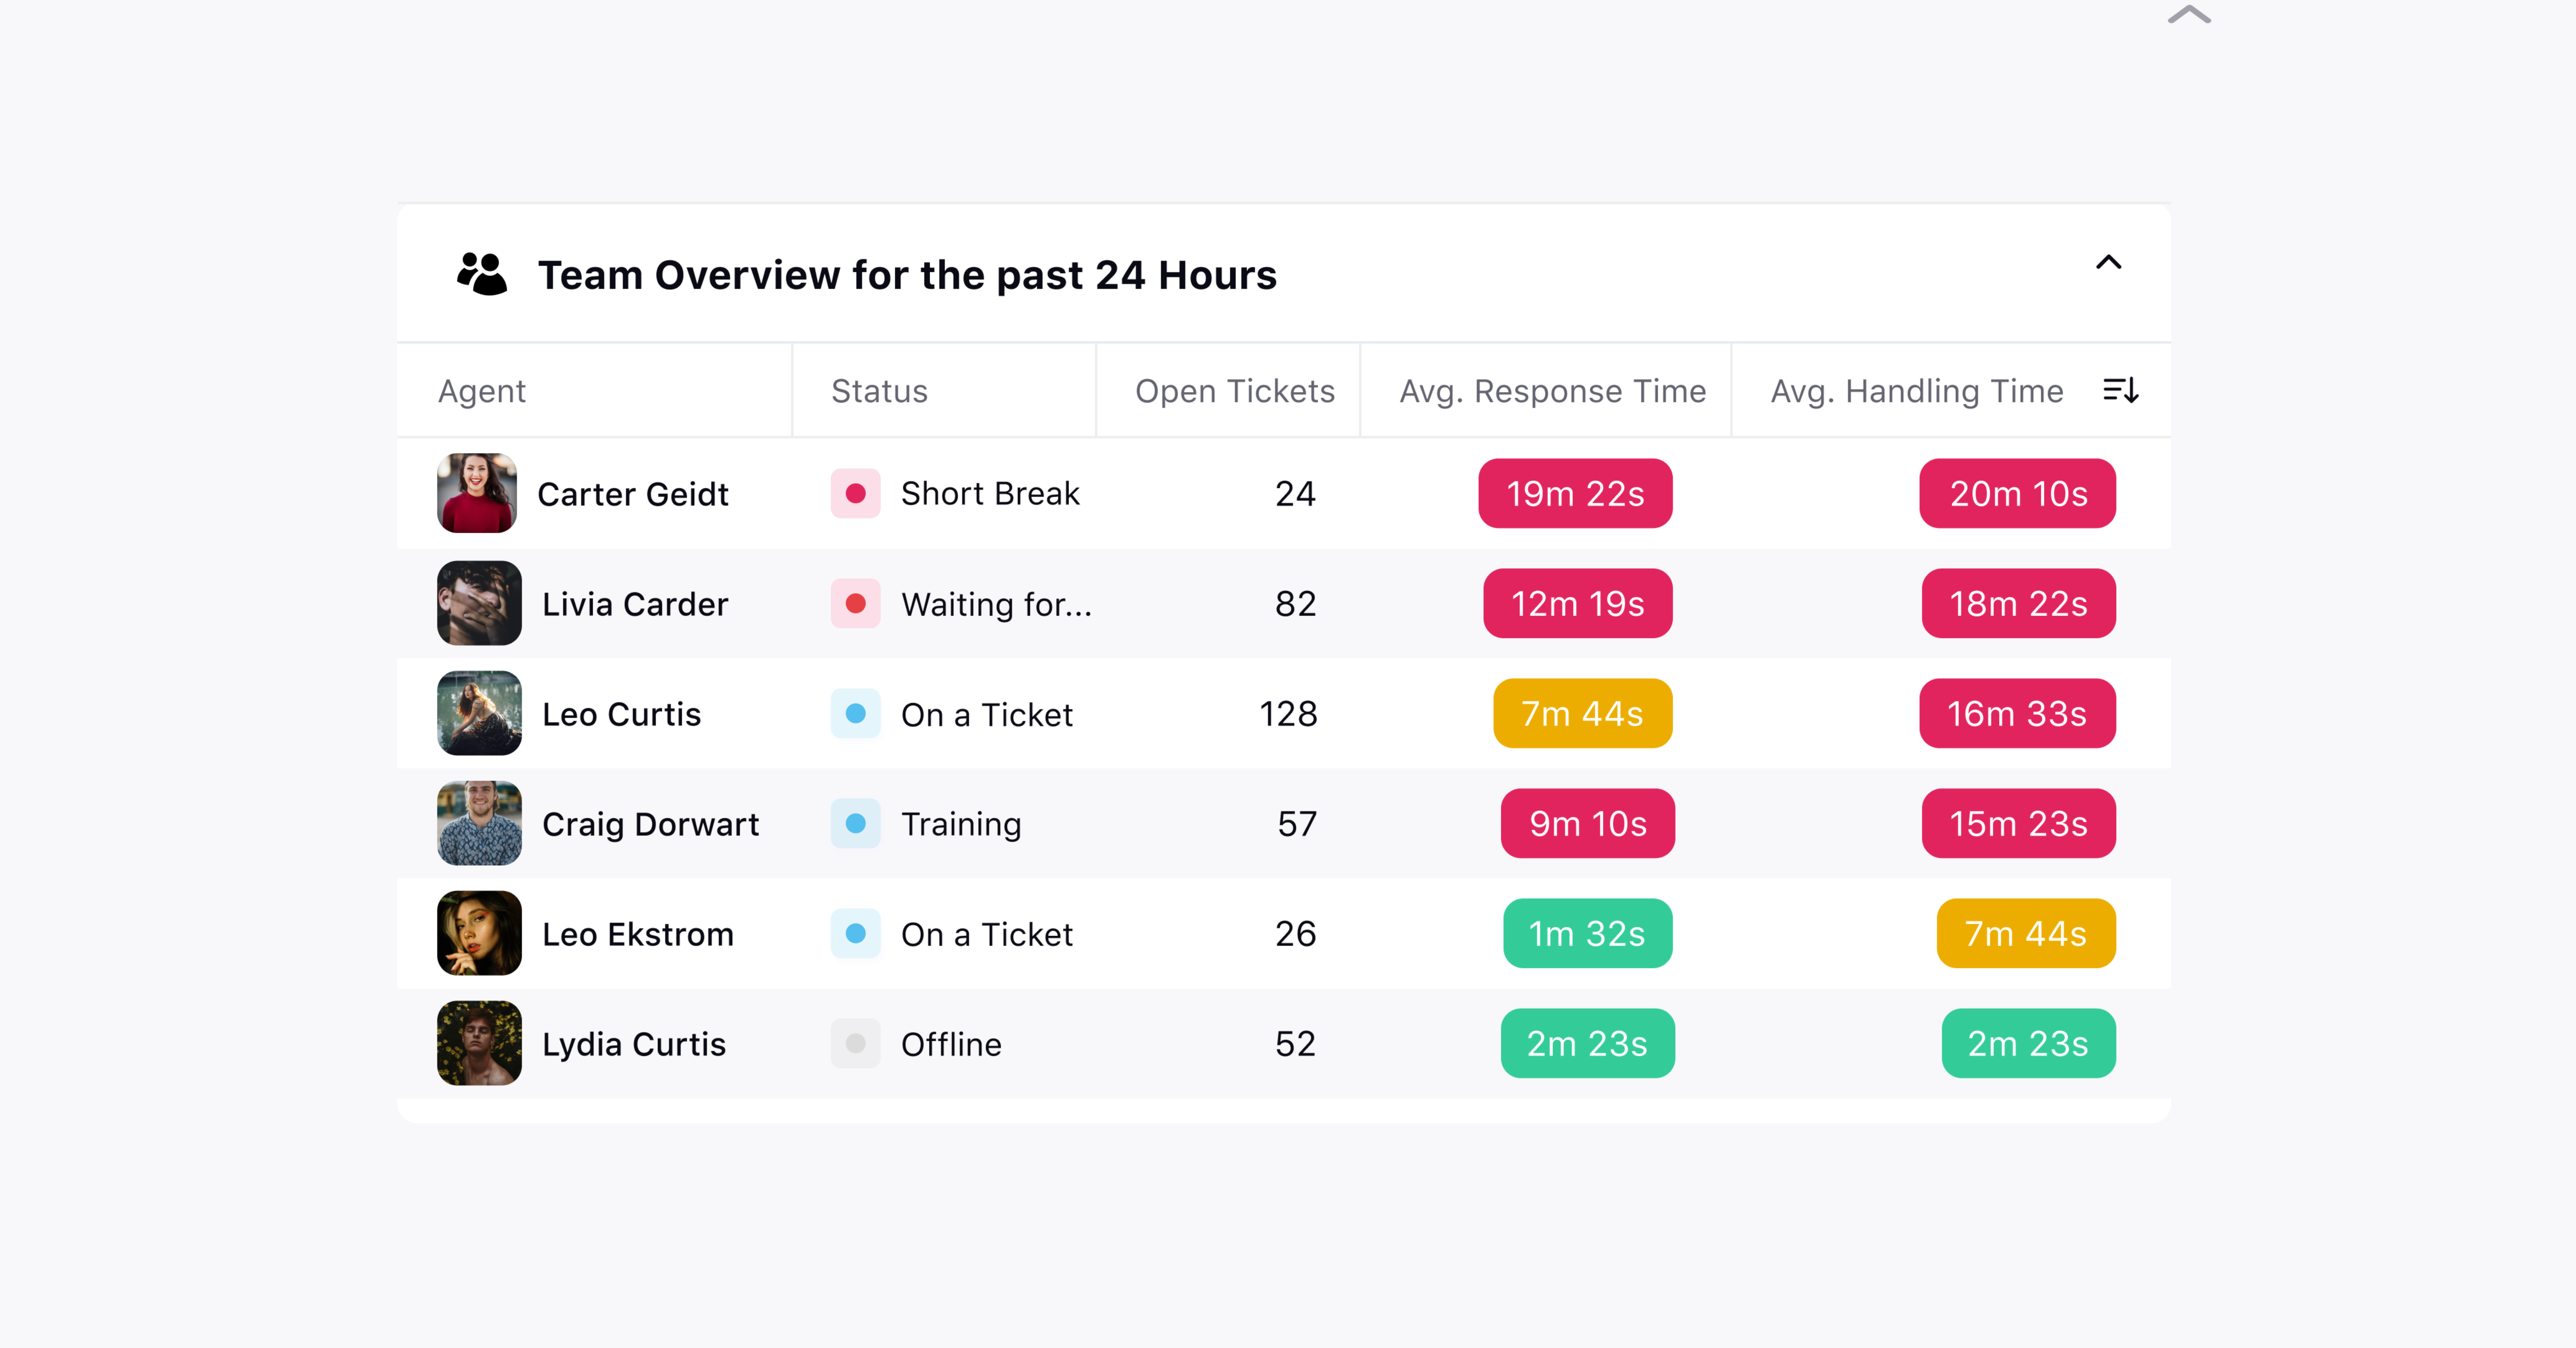 |
Tickets Received | Displays the number of tickets received by each team in your workspace.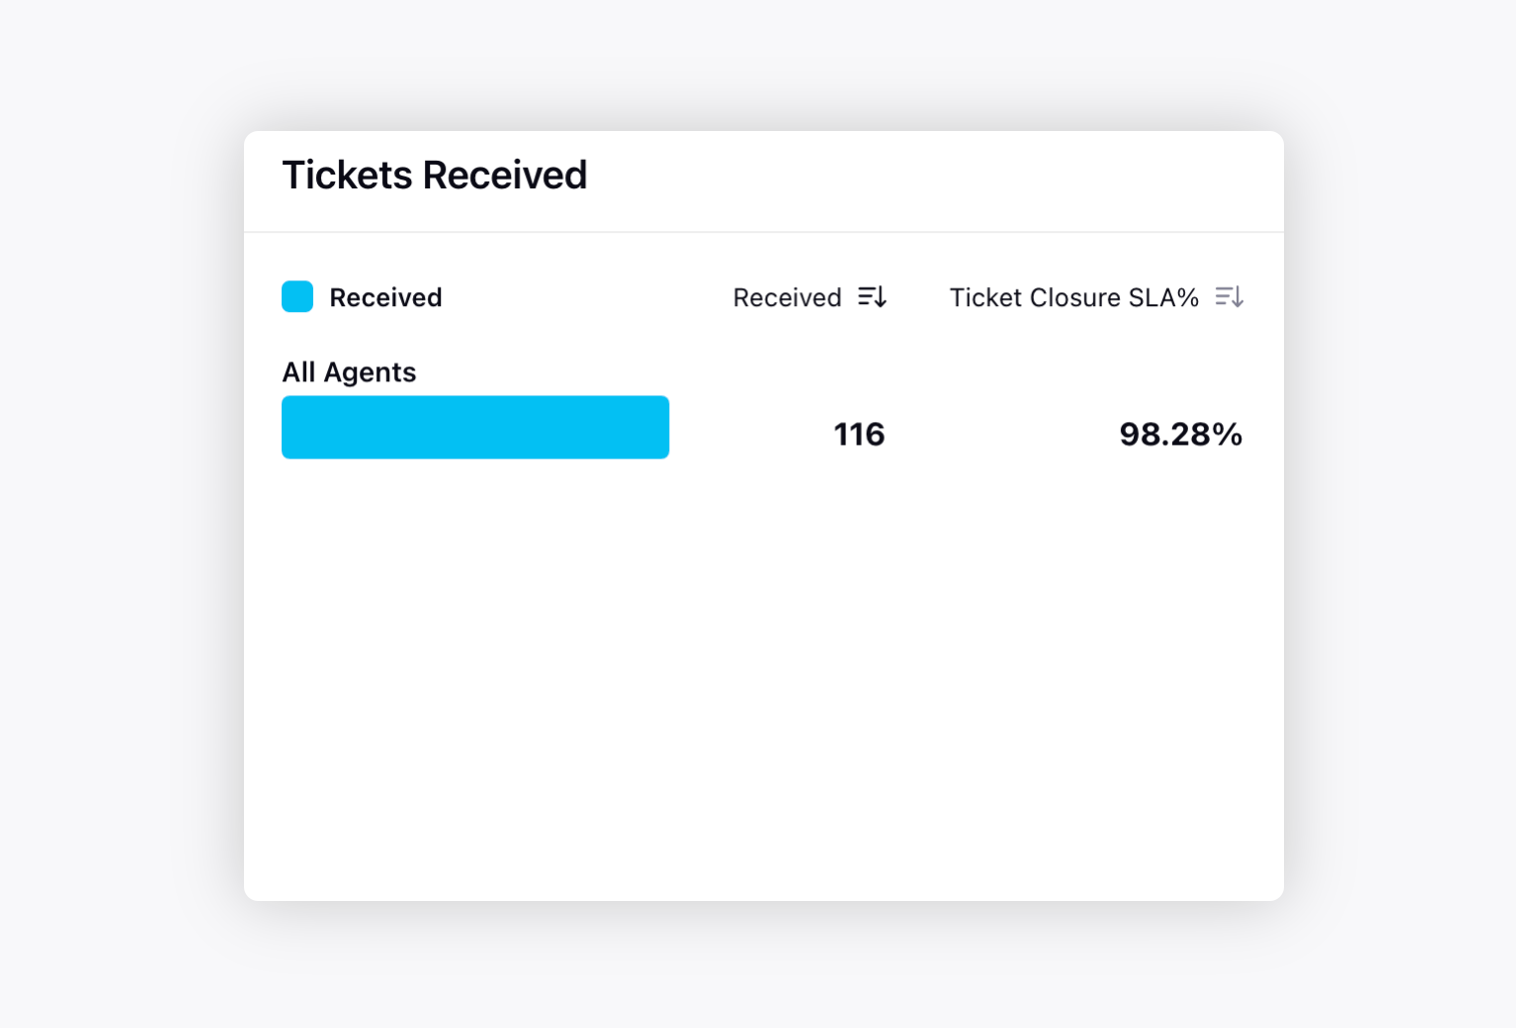 |
Login Hours | Displays the overall login hours of the teams.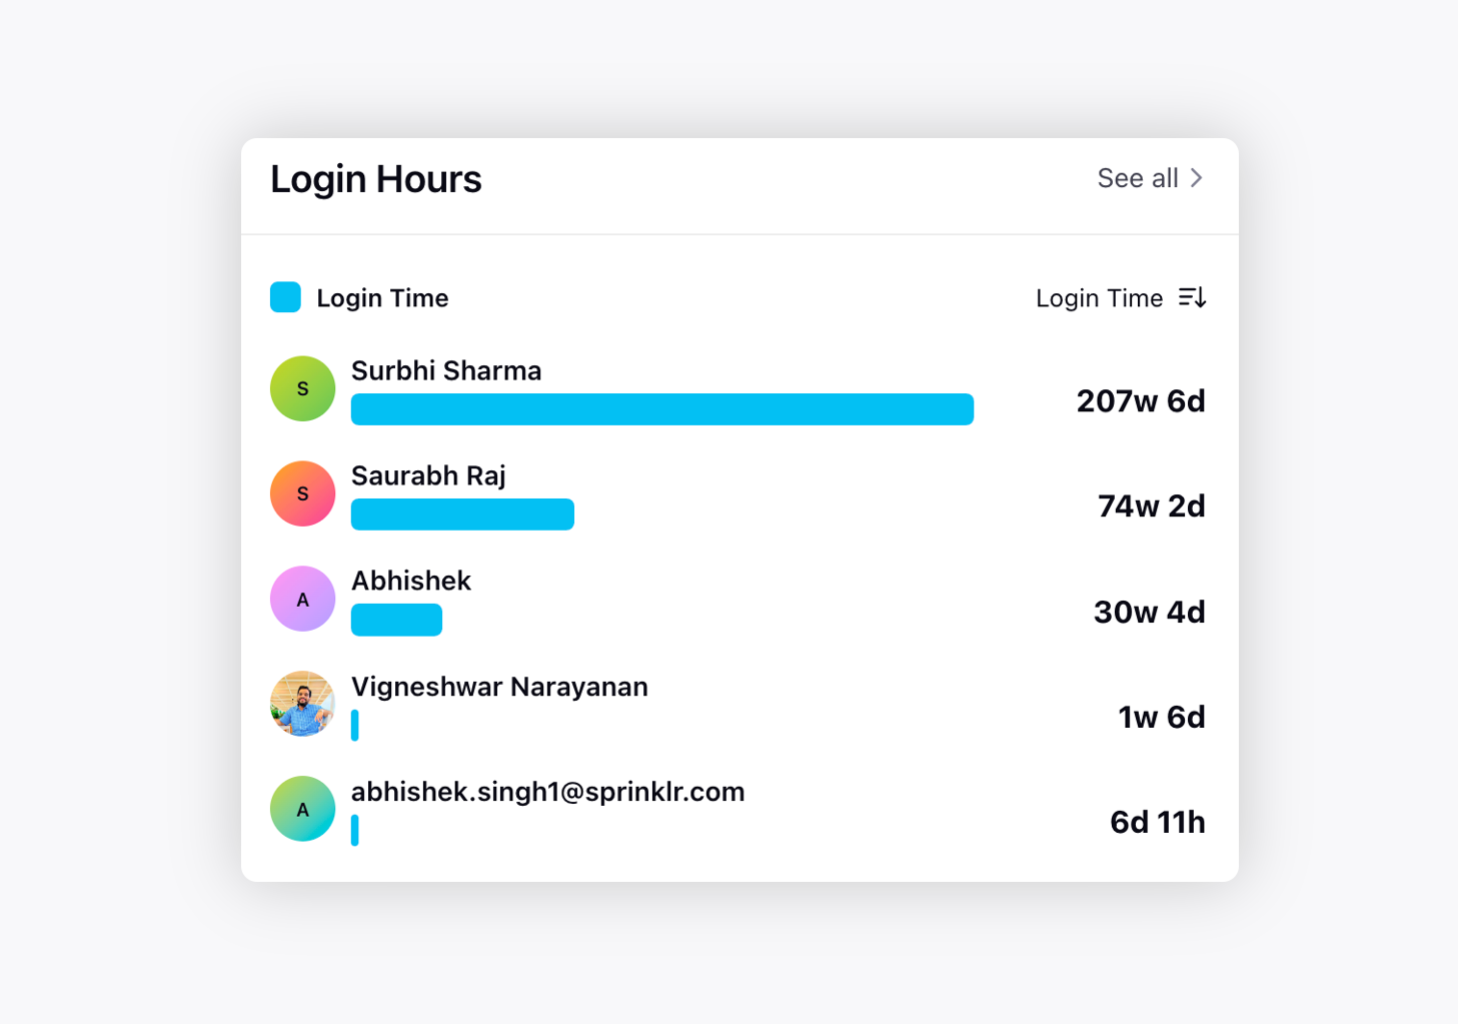 |
Handling Time & CSAT | Displays the average handling time of the issues for each team along with their respective CSAT scores.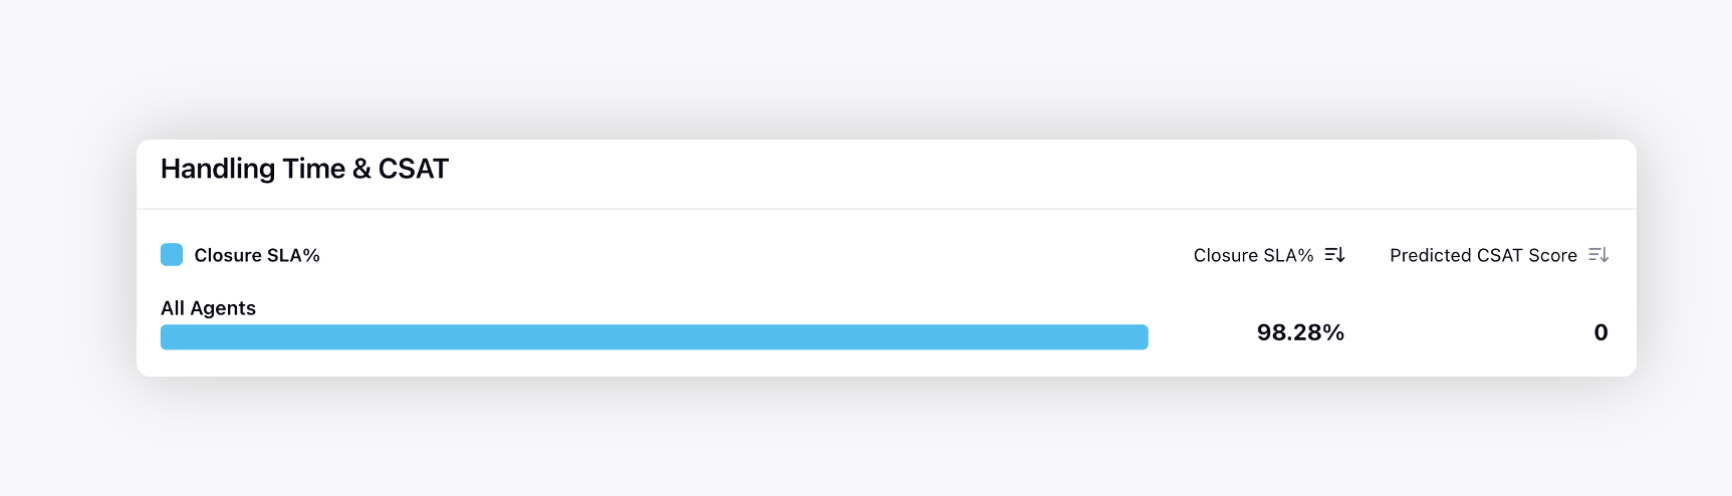 |
Tickets Reopened | Displays the number of reopened tickets for each team.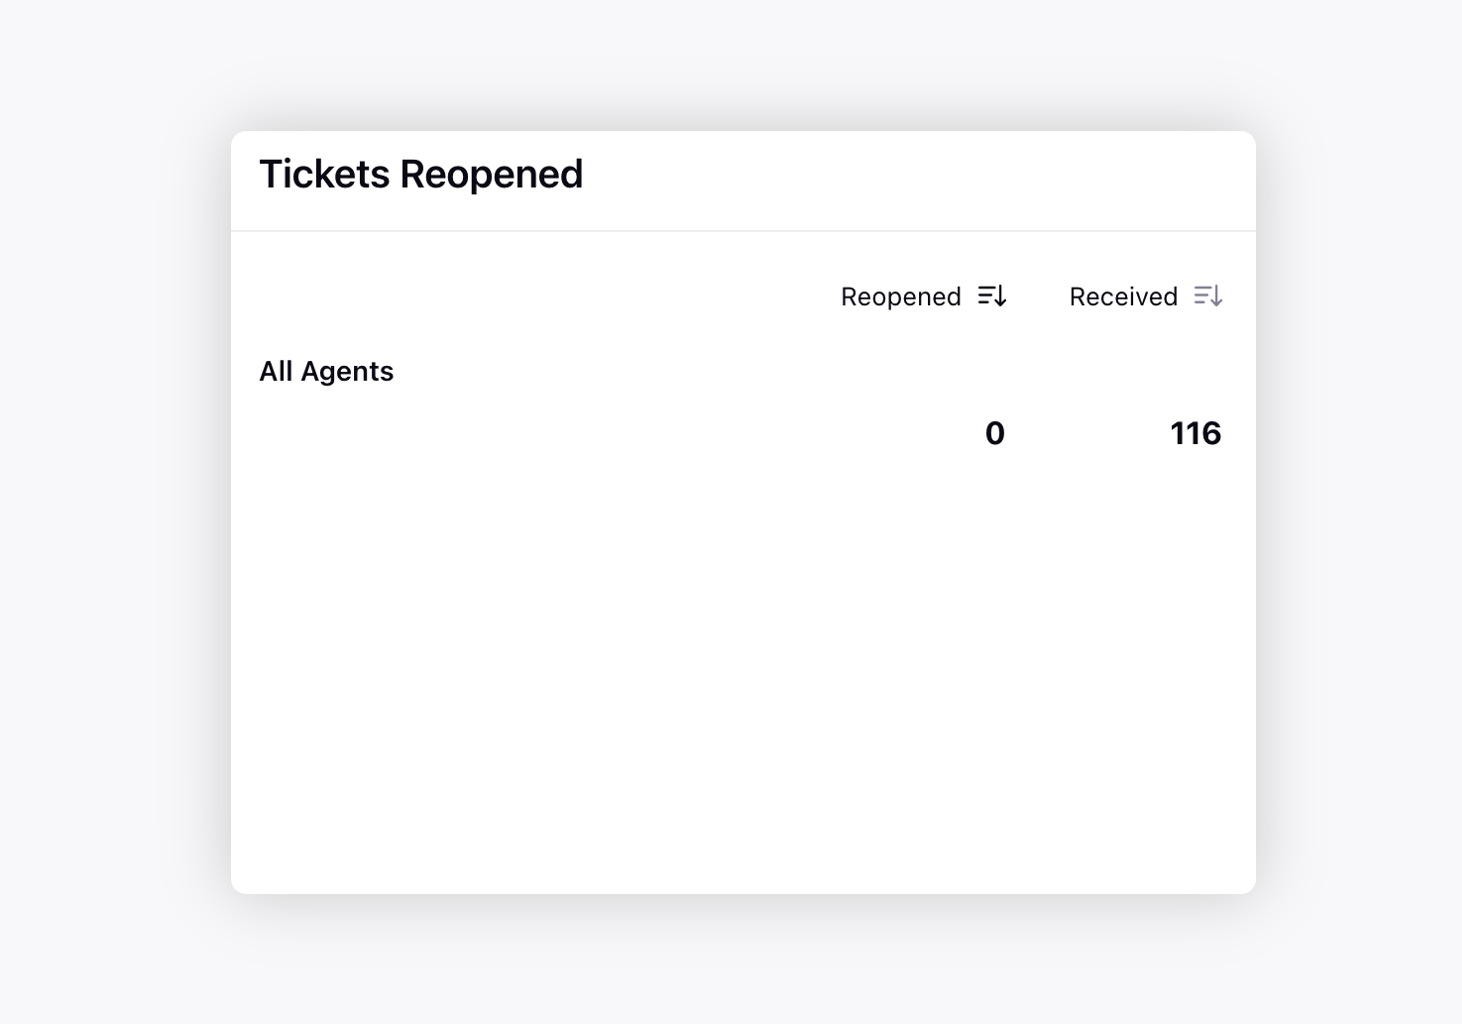 |
First Response | Displays each team’s average first response time in your workspace.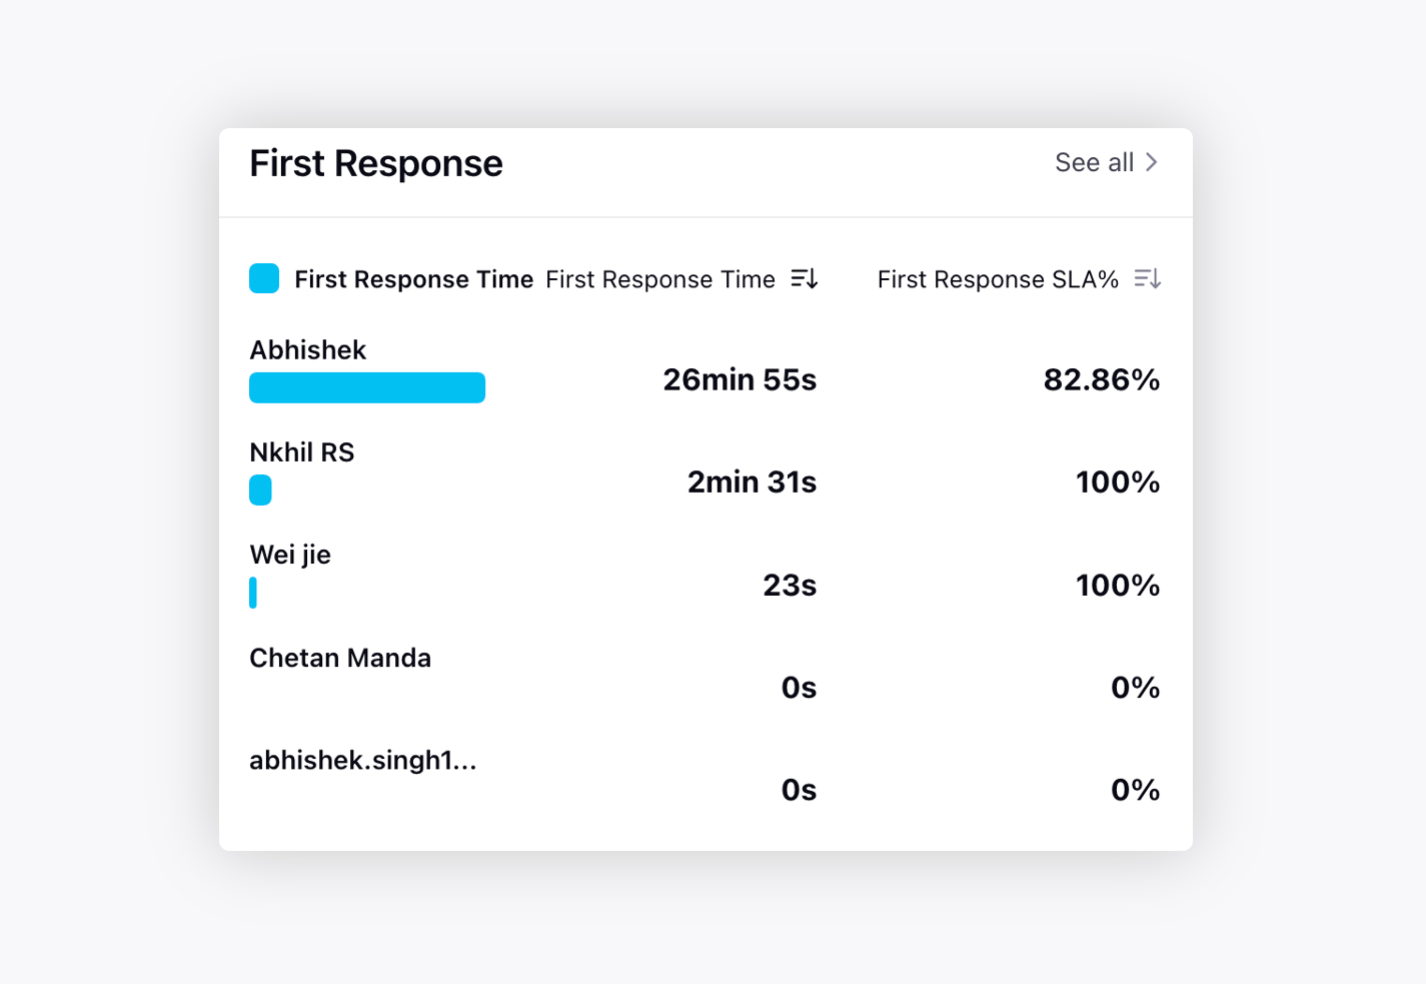 |
Agents
Widget Name | Description |
Agent Performance | Displays the performances of each agent in your workspace with respect to received tickets, closed tickets, ticket closure SLA%, average login time, total handling time, average handling time, predicted CSAT score, reopened tickets, average first response time, and first response SLA%.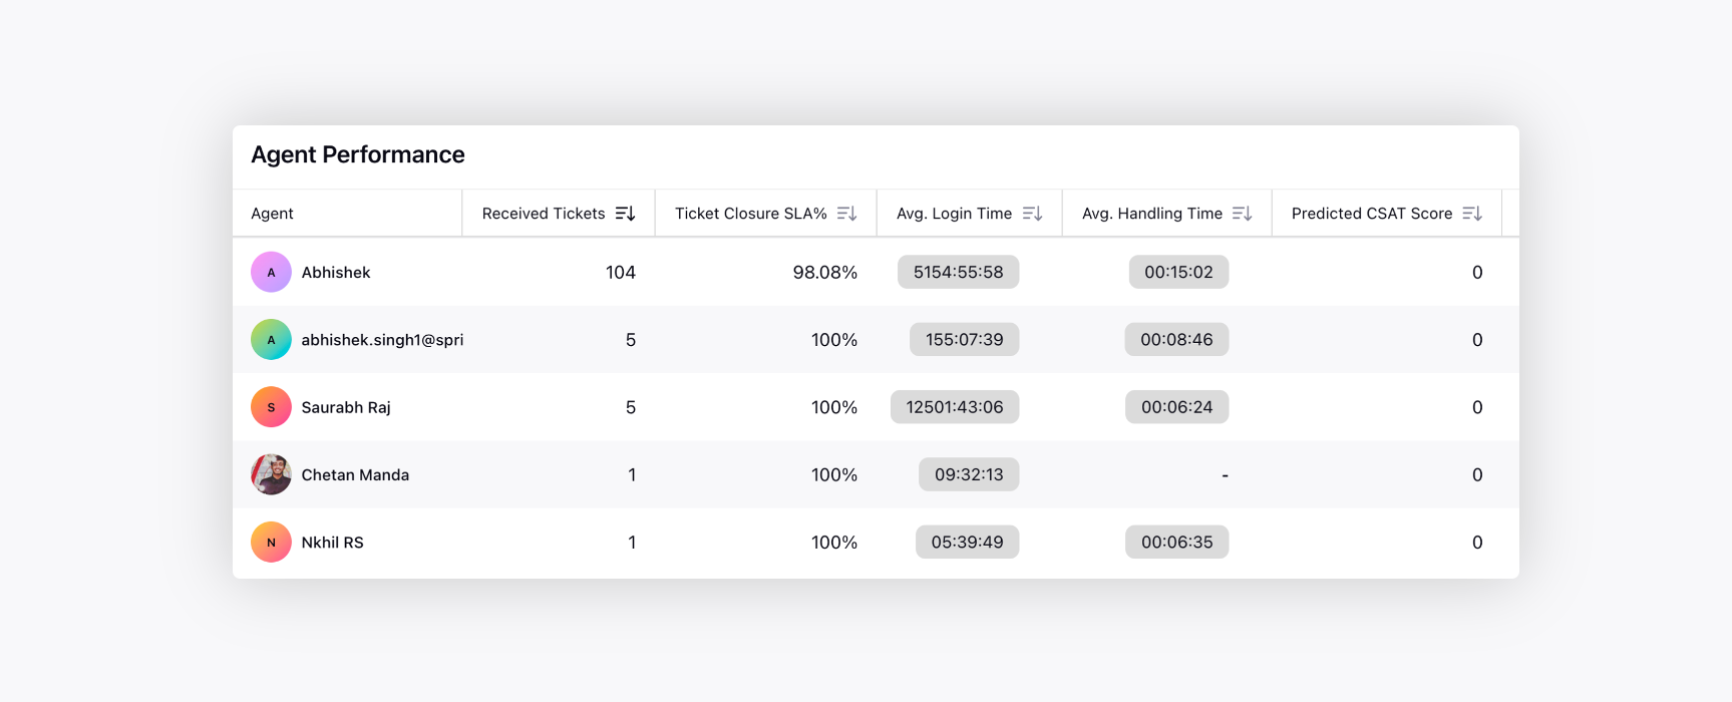 |
Tickets Received | Displays the number of tickets received by each agent in your workspace.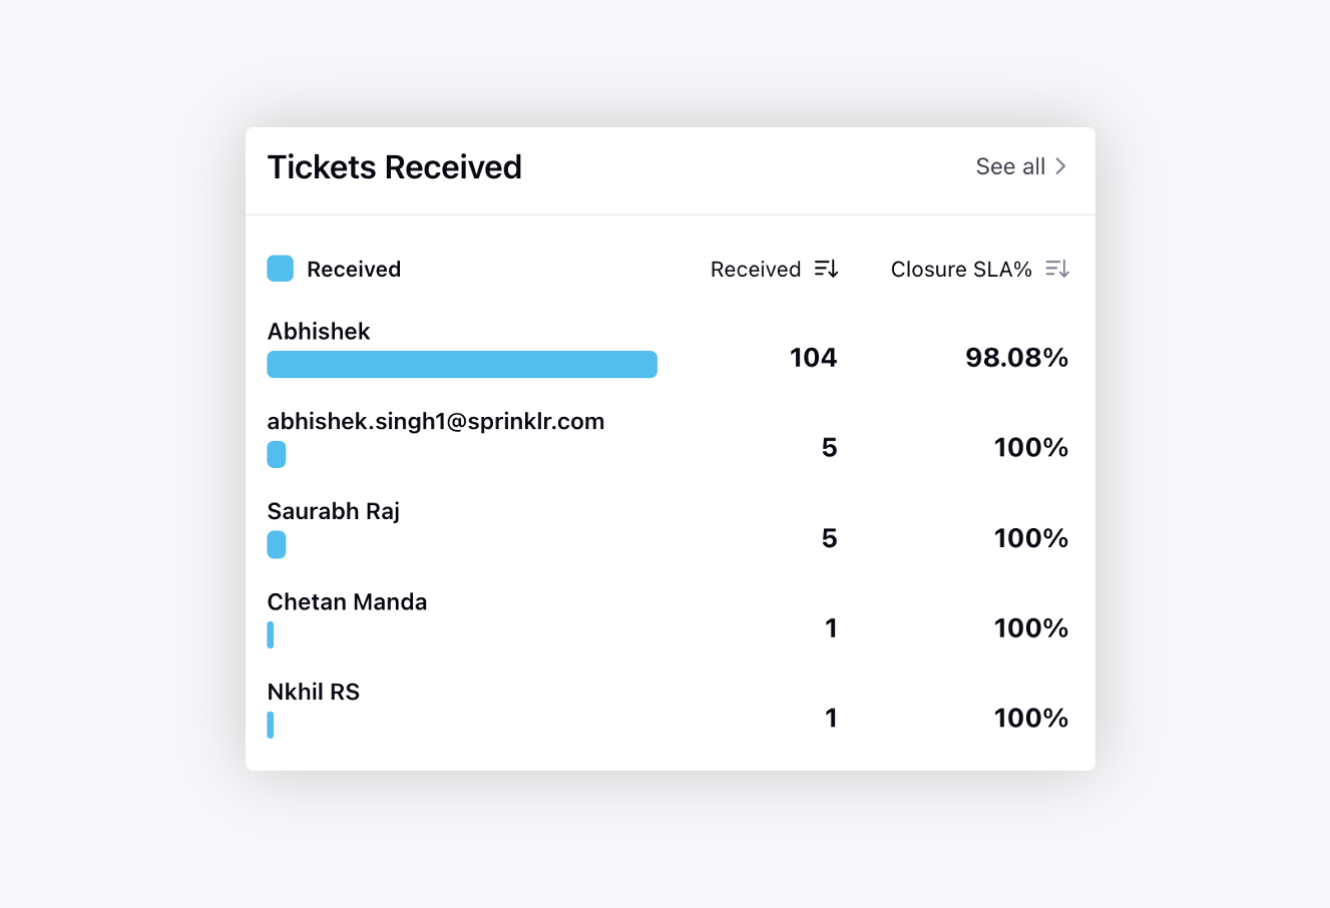 |
Login Hours | Displays the overall login hours of the agents.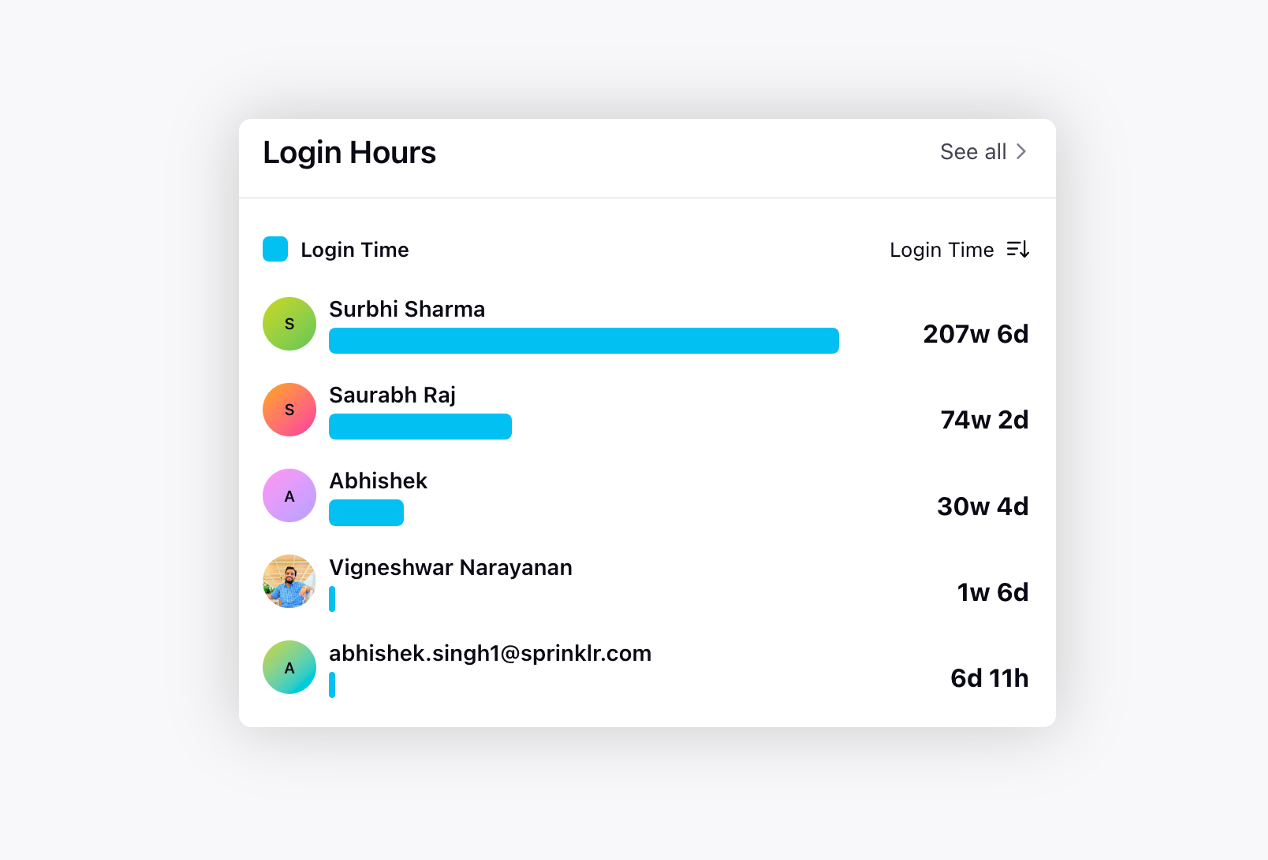 |
Handling Time & CSAT | Displays the average handling time of the tickets for 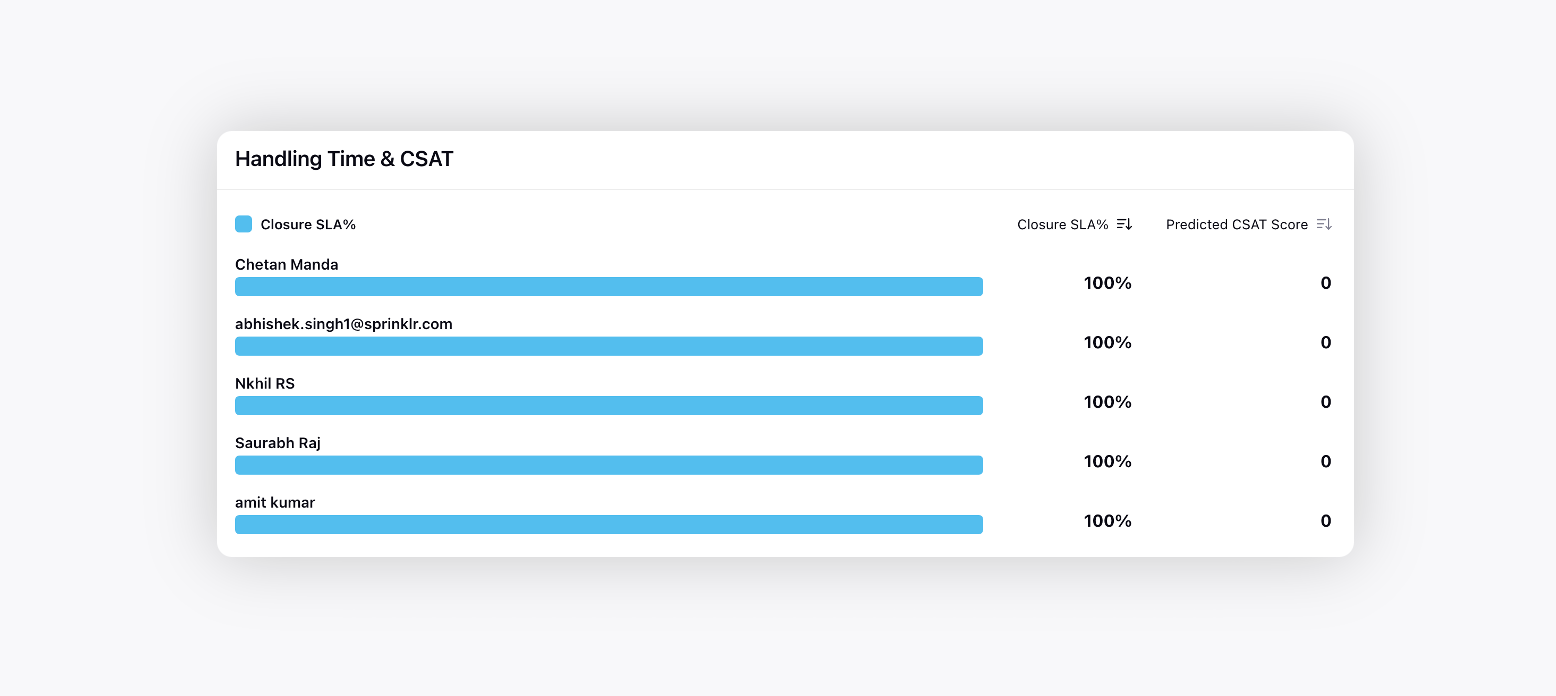 each agent along with their respective CSAT scores. each agent along with their respective CSAT scores. |
Tickets Reopened | Displays the number of reopened tickets for each agent.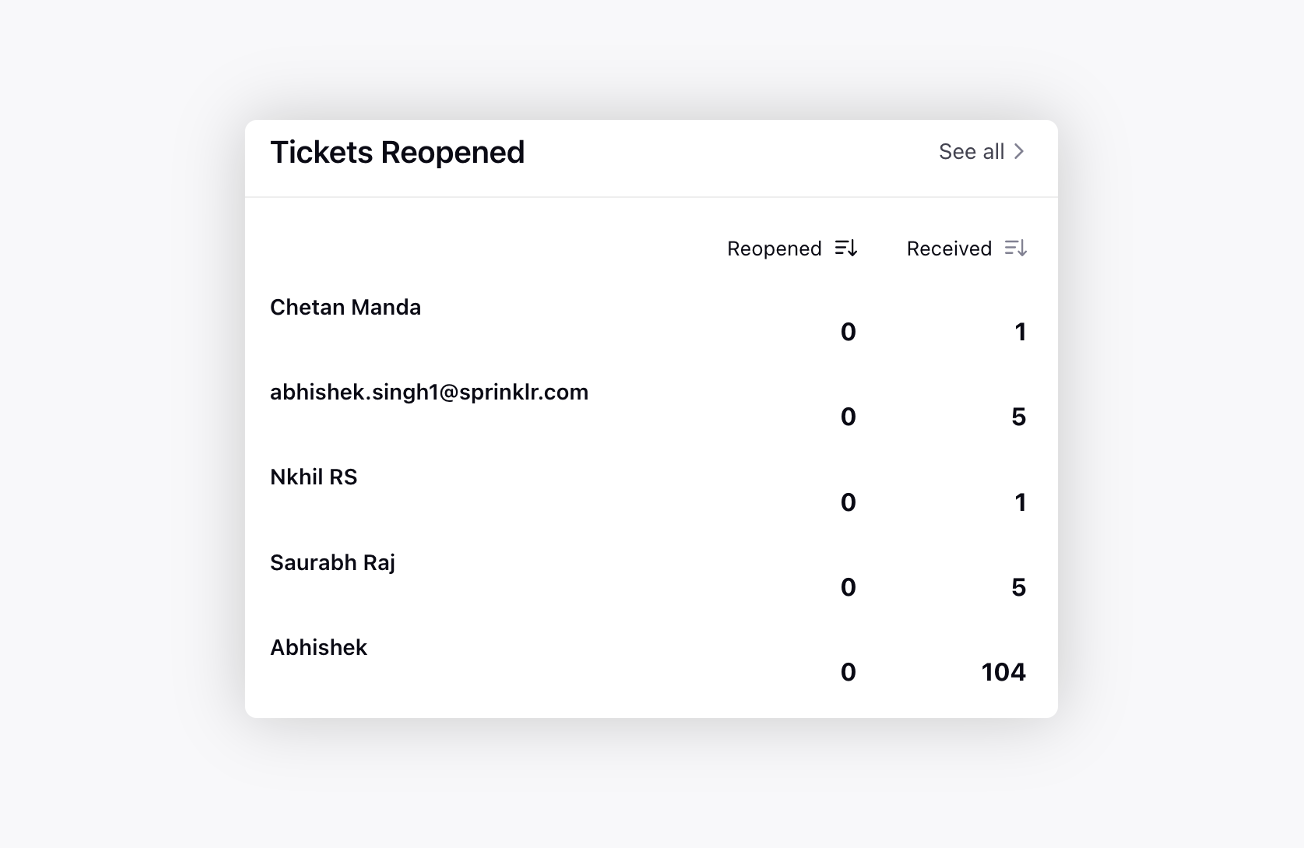 |
First Response | Displays each agent's average first response time in your workspace.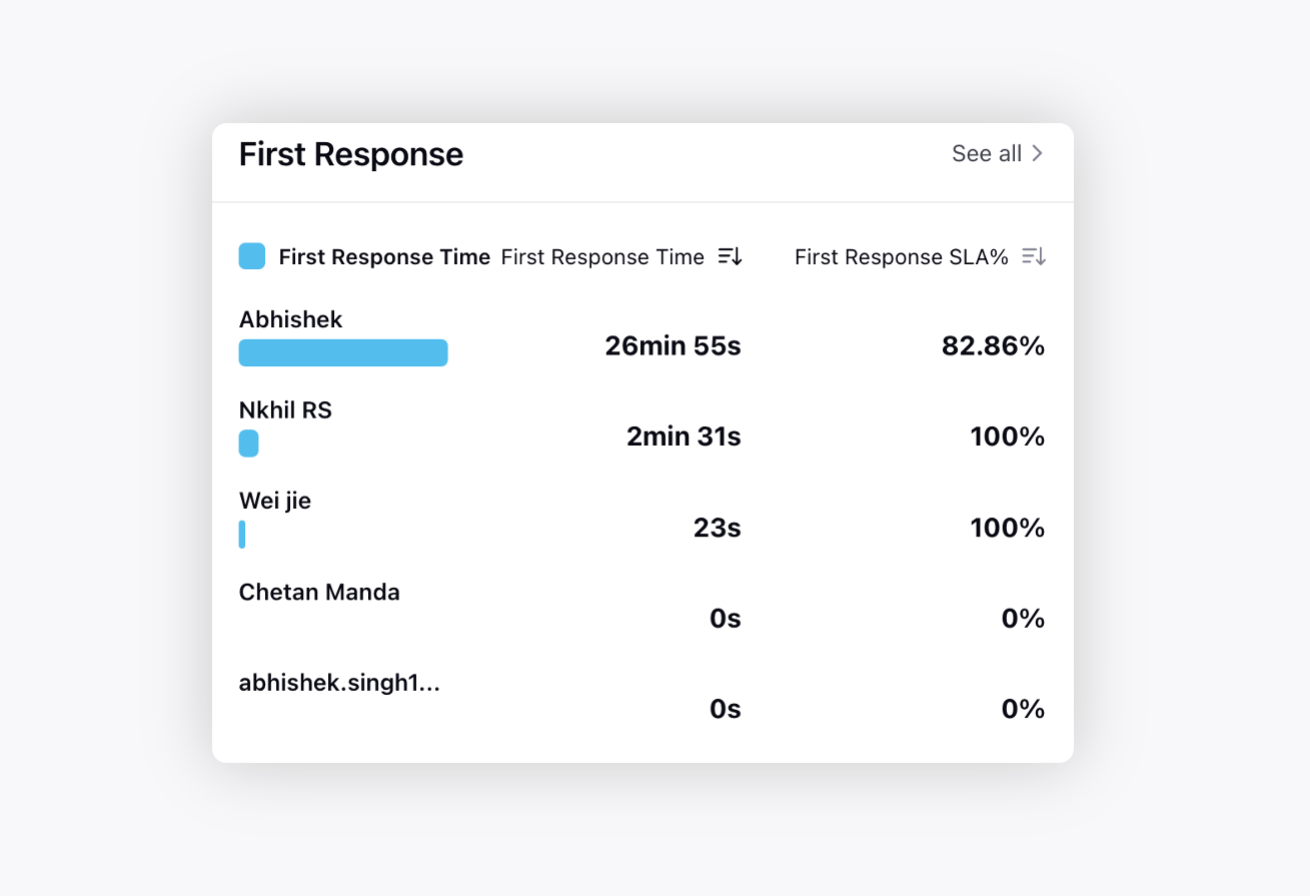 |
