
Tiktok Platform Performance Report
Updated
This report provides comprehensive statistics on engagement, publishing, and various activities on your TikTok accounts. It includes detailed insights into video performance, user interactions, and audience behavior, helping you optimize your content strategy and enhance engagement on the TikTok platform.
Use the TikTok Platform Performance Report to review the lifetime performance of the TikTok posts which have published during the publishing period.
Navigate to TikTok Platform Performance Report
Log in to Care Console. On the Sprinklr Self-serve window, click Reports icon on the left pane.
The TikTok Platform Performance Report can be found in the Platform Performance section of Sprinklr Self-serve.
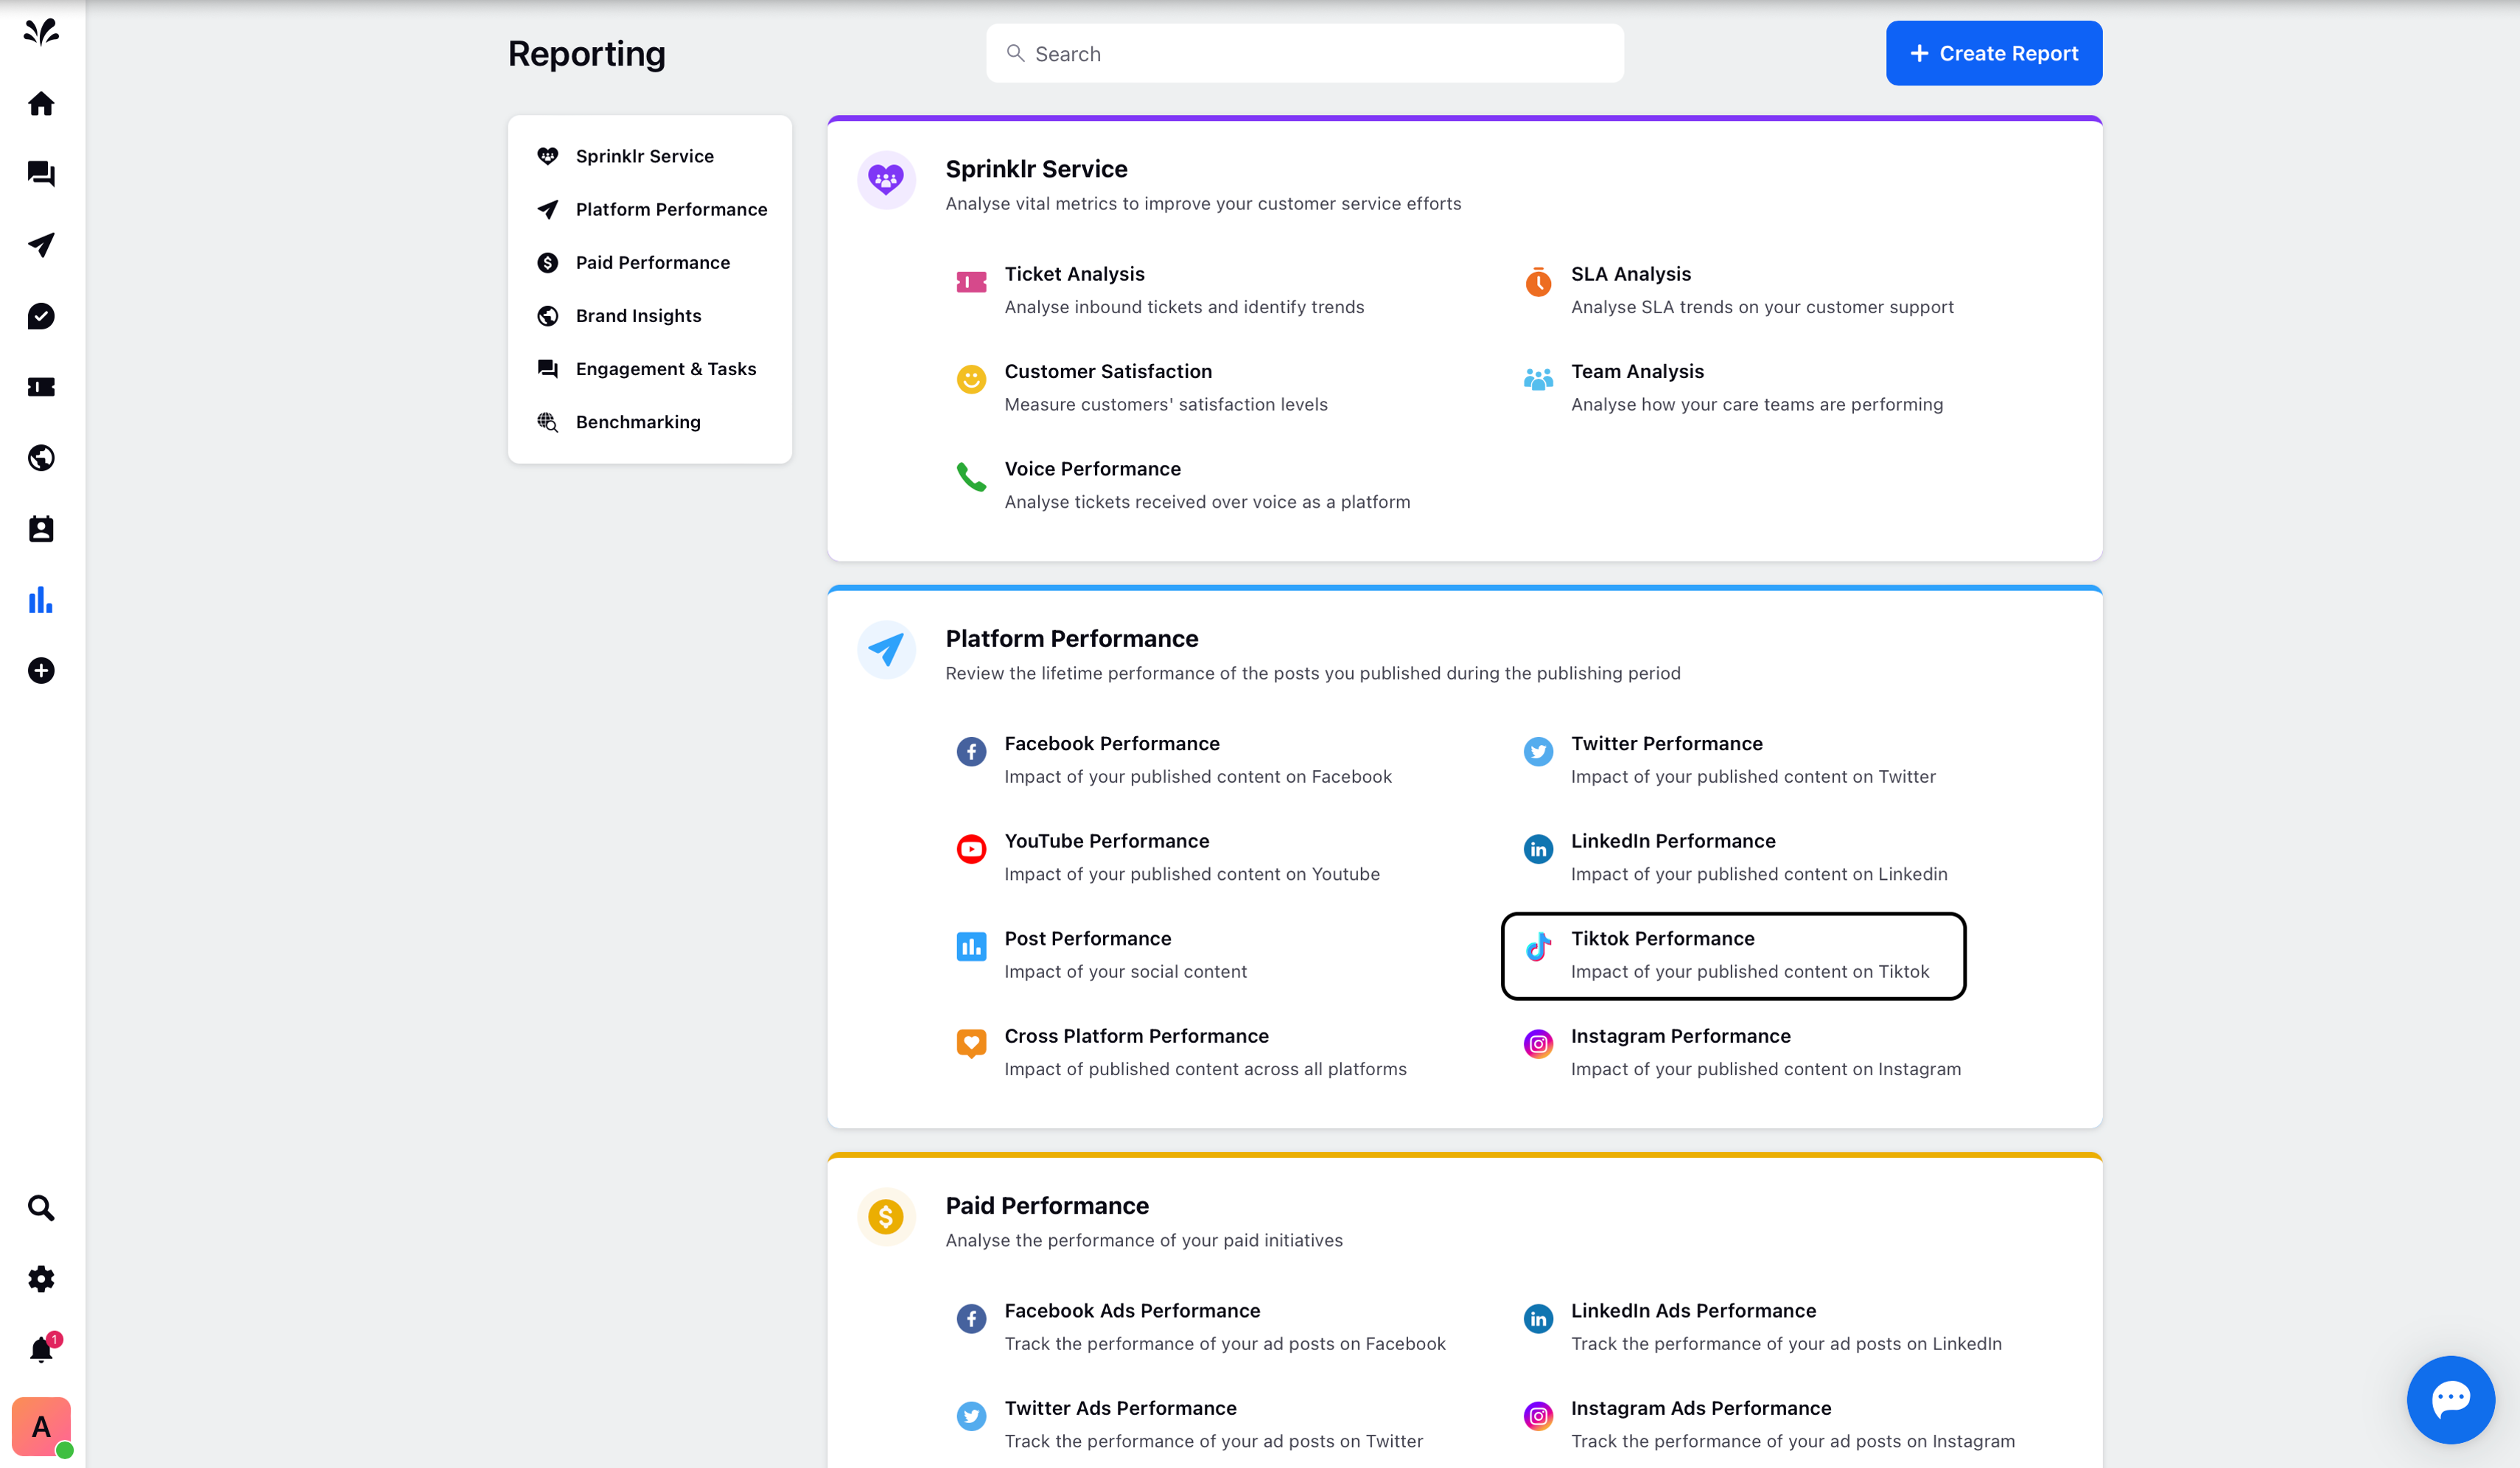
TikTok Performance Report
TikTok Performance report have 4 tabs respectively:
Overview
Engagement
Content
Audience
Here are the detailed description of the above mentioned Tabs:
Overview tab: This tab consists of following Widgets -
Here are the detailed description of the above mentioned widgets:
Performance Summary: This widget consists of metrics such as followers, profile views, video views, published posts, reach, and account video views. You can click on any metric to view details in the third pane for the current as well as the previous period.

Trend of Total Followers: The trend of total followers for the TikTok video over a period of time. You can click on a specific date to view details in the third pane.

Net Growth of Followers: The net growth of followers for the TikTok Video over a period of time. You can click on a specific date to view details in the third pane.

Trend of Reach: The total number of unique viewers who viewed the video. This trend metric presents a value by the Date of engagement. You can click on a specific date to view details in the third pane.

Impressions % by Source: The Source-wise percentage distribution of Impressions used in conjunction with the dimension TikTok Video Source. You can click on a specific date to view details in the third pane.

Engagement tab: This tab consists of following Widgets -
Here are the detailed description of the above mentioned widgets:
Engagement Summary: The overall summary of engagement in a TikTok video includes video likes, comments, shares, account likes, shares, and comments. You can click on a specific metric to view details in the third pane for the current as well as previous periods.

Brand Engagement Breakdown: The breakdown of brand engagement on a Tiktok video such as video likes, comments, and shares. You can click on a specific date to view details in the third pane for the current as well as previous periods.

Average Video Watch Time Trend: The average video watch time on a TikTok video over a period of time. You can click on a specific date to view details in the third pane for the current as well as previous periods.

Engagement by Day of the Week: The engagement on the TikTok video by the day of the week. You can click on the particular bar to view details in the third pane for the current and previous periods.

Engagement by Time of the Day: The engagement on the TikTok video by the day of the day. You can click on the particular time to view details in the third pane for the current and previous periods.

Post Scorecard: The scorecard consists of overall TikTok post engagement such as views, likes, shares, comments, reach and video watched to completion rate.

Content tab: This tab consists of following Widgets -
Post Published: The posts published on the TikTok platform over a period of time. You can click on a particular bar date to view details in the third pane.

Trend of Video Views: The total number of views the video has received. This trend metric presents a value by the Date of engagement.

All Posts: The list of all Tiktok posts segregated by metrics such as Video likes, comments, and shares. Click on See all posts in the top right corner to view details in the third pane.

Audience tab: This tab consists of following Widgets -
Here are the detailed description of the above mentioned widgets:
New Followers Gained by Gender: Gender distribution of business accounts followers. This information is available as an aggregate of the previous 60 days. This information is not available for accounts with less than 100 followers.

New Followers Gained by Country: Country distribution of business accounts followers. This information is available as an aggregate of the previous 60 days. This information is not available for accounts with less than 100 followers. You can click on a particular country to view details in the third pane.

Followers Online by Hour: The number of followers online in each hour of the day. This information is available per day. This information is not available for accounts with less than 100 followers. You can click on a particular hour to view details in the third pane.
